Chapter 8 — Bullion banks and the lease rate
There are about a dozen banks in the world that make a market in gold.
That phrase has a specific meaning. A market-making bank stands ready, all day, to quote a bid and an offer to any of its institutional clients. A central bank in Singapore that wants to sell 10 tonnes calls one of these banks. A Swiss refinery that needs to lease 2 tonnes for a week's production calls one of these banks. A mining company hedging a quarter's output calls one of these banks. The bullion banks are the plumbing through which physical gold actually moves between the world's vaults and the world's industrial and investment users.
The major bullion banks at the time of writing are JPMorgan, HSBC, UBS, ICBC Standard, Bank of China, Bank of America, Scotia (through its successor entities), and a handful of smaller players that participate in the LBMA fix. Together they handle most of the world's wholesale gold trading.
A retail trader can go their entire career without ever needing to know who the bullion banks are. But there is one thing the bullion banks do that throws off a signal every gold trader should know how to read: they lease gold. And the rate at which they lease it — the gold lease rate — is one of the quietest and most useful sentiment indicators in the market.
What a bullion bank actually does
Imagine a Swiss refinery. They take 400-ounce London Good Delivery bars and cast them into 1-kilo bars for Chinese demand. The refinery's business is a high-volume, low-margin operation: they make a few dollars per ounce on the cast. To run the refinery profitably, they need a constant inventory of input gold — typically several tonnes at any given moment.
But the refinery doesn't want to buy that gold outright. Tying up tens of millions of dollars in metal inventory eats their working capital. So they lease it.
A bullion bank that holds a position of, say, 1,000 tonnes of unallocated gold in its London vault has metal sitting still. The bank lends some of that gold to the refinery on a short-term basis — typically 1 month, 3 months, 6 months — at an interest rate quoted in basis points per year. The refinery uses the gold for production, then either returns the same quantity at the end of the lease or buys gold in the market to settle the lease in metal.
This lease market is large, multi-trillion-dollar-notional, and almost entirely OTC. It exists because gold sits still otherwise. The lease rate compensates the bullion bank for the credit risk of the lessee and for the opportunity cost of not having the gold available for other uses.
What the lease rate tells you
The 1-month, 3-month, 6-month, and 12-month gold lease rates are quoted by the bullion banks and have historically been published in a daily survey by the LBMA (until 2015, when the public publication was discontinued; rates are still quoted but require a Bloomberg or Reuters terminal to see continuously).
Here is the signal:
Low or negative lease rates mean the bullion banks have plenty of gold and few people want to borrow it. The supply of leasable gold exceeds demand. This is a bullish signal for gold price, somewhat counter-intuitively. When banks are flush with metal that nobody wants to borrow, it means the bullion banks don't see strong industrial or speculative demand for short-term gold supply. Counter-intuitive, but historically reliable.
High lease rates mean demand for borrowed gold is outpacing supply. The bullion banks are tight on metal. This is bearish for gold price — banks tight on metal historically corresponds to refineries running flat-out to satisfy retail and industrial demand, which usually happens late in a price rally.
Why does this work? Because lease rates reflect the physical-market tightness that the futures and spot prices may not yet have picked up. The bullion banks see the physical demand directly, weeks before it shows up in the news. Their willingness to lend gold cheaply (low rates) or their reluctance to lend (high rates) is a quiet leading indicator.
The cleanest examples:
- November 2008 — 1-month lease rate spiked from 0.05% to over 2.5% during the GFC margin call cascade. Sharp lease rate spike, gold fell over the following weeks as margin selling forced even physical positions out.
- 2011 top — 1-month lease rates rose to 0.4% in August 2011 as parabolic retail demand pulled physical from the system. Lease rate peaked roughly two weeks before the price top.
- 2020 LBMA-COMEX divergence — lease rates spiked sharply through late March 2020 as the physical channel broke. The lease rate signal preceded the spot disruption.
- 2024 PBoC resumption — lease rates trended down through the second half of 2024 as central bank buying absorbed physical supply but didn't drive borrowing demand. Lease rates falling alongside price rising was the cleanest bullish confirmation in that cycle.
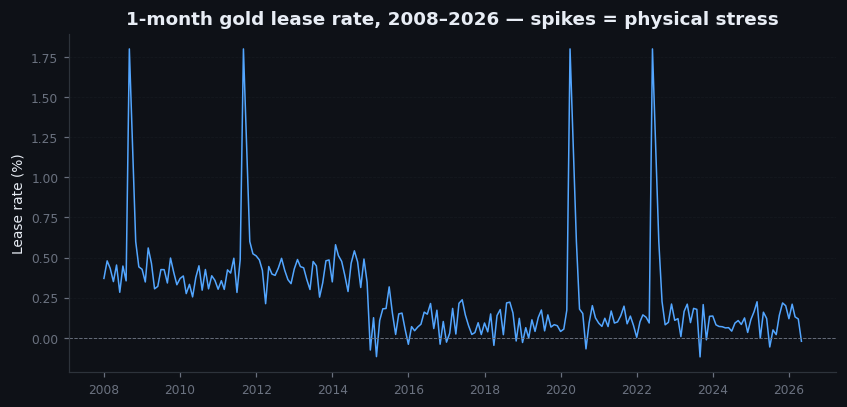
Figure 8.1 — 1-month gold lease rate, 2008–2026
Line chart. 1-month gold lease rate (LIBOR-equivalent basis) from 2008 to 2026. Annotated peaks: Nov 2008 (GFC), Aug 2011 (price top), Mar 2020 (LBMA-COMEX divergence), several smaller peaks. Annotated troughs: 2013, 2015, 2019, 2024 — each preceded or coincided with a bullish phase. Background shading for gold bull and bear periods to show alignment.
Illustrative — illustrative lease-rate path, calibrated to known stress events.
The historical context — and a small scandal
The lease rate market has had its own moments of controversy.
Through the 1990s, mining companies engaged in a practice called forward hedging. A miner with future production would lease gold from a bullion bank, sell it immediately in the spot market, pocket the cash, and then deliver future-produced gold back to the bank at the end of the lease. Effectively, they were borrowing gold to short the gold price. This was profitable as long as prices were stable or falling — which they were, through the 1990s bear market.
By 1999, the major gold miners (Barrick, AngloGold Ashanti, Newmont) had collectively short-sold 10-12 years of forward production through these lease arrangements. This was a structural headwind for the gold price, adding hundreds of tonnes a year of "synthetic supply" to the market.
When gold turned in 2001 and started rising, the miners began unwinding these hedges — buying back the borrowed gold in the spot market. The unwinding ran from 2001 to about 2010. By the time it was complete, the major miners had spent $15 billion buying back gold at progressively higher prices to close their hedge books. This unwinding was a structural buyer for an entire decade, and is the most under-appreciated driver of the 2001-2011 bull market.
The lesson for a modern trader: the lease market connects the physical, the futures, and the corporate hedging worlds. When lease rates do something unusual, look upstream. There is almost always a structural reason — and it usually leads the visible price action by weeks or months.
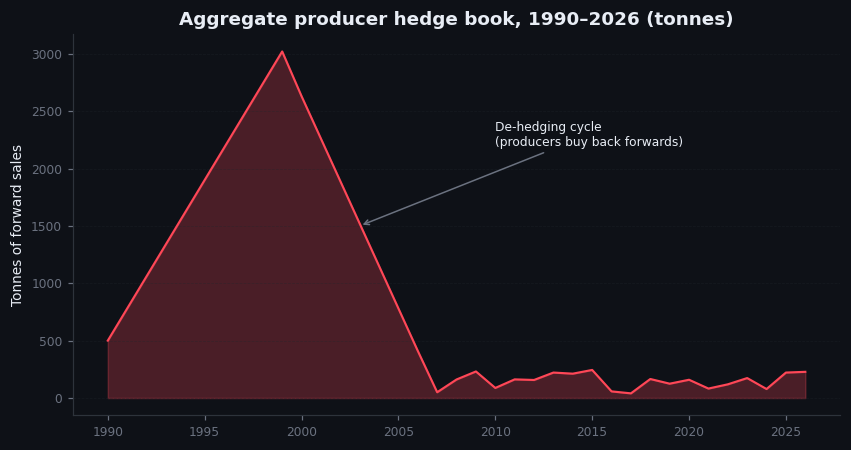
Figure 8.2 — Mining company forward hedge book, 1990–2026
Bar chart. Aggregate ounces of forward production hedged by the top 10 gold miners, annually 1990 to present. Build-up from 1990 to 1999, peaking at roughly 100 million ounces. Steady unwind from 2001 to 2010 (the structural buyer). Near-zero hedging from 2011 onward as miners learned the lesson. Slight uptick in 2024-2025 as some miners begin selective hedging of high prices into 2026.
Illustrative — illustrative — aggregate producer hedge book, calibrated to industry estimates.
On goldintel today
The dashboard does not currently surface lease rates. If you want them, the cleanest free-tier source is the New York Federal Reserve's H.15 statistical release (which historically included gold lease rates derived from LBMA data), or a Reuters terminal if you have access. There is also a workable proxy: the GOFO rate (Gold Forward Offered Rate), which is the lease rate's mirror image and can be derived from publicly quoted gold forwards. When GOFO goes negative, lease rates are positive — and vice versa.
I would consider adding a lease-rate proxy to the dashboard. It is an institutional indicator and most retail traders never see it. That is exactly why it is informative.
Common mistakes
- "High lease rates are bullish, like high interest rates make a currency strong." Wrong analogy. High gold lease rates mean physical demand is outpacing supply, which historically means we are late in a price rally. Counter-intuitive, but consistent.
- "Lease rates don't matter because I don't trade gold lease swaps." They tell you what the bullion banks see in the physical market. That is information you cannot get from the spot or futures chart.
- "Mining companies still forward-hedge." Most do not, after the painful unwind of 2001-2010. A few selectively hedge at price extremes (some did so in 2024-2025 at $2,800-$3,000), but the scale is a fraction of the 1990s structural hedging.
- "Lease rates are public." They are quoted, but daily public publication was discontinued in 2015. Real-time access requires a Bloomberg or Reuters terminal. Public users can find weekly LBMA bullion liquidity reports and the Fed H.15 historical archive.
Key takeaway
The gold lease rate is a quiet indicator that reflects physical-market tightness before it shows up in the spot price. Low lease rates are bullish; high lease rates are bearish. Watch it as a complement to the chart, not a substitute.
Further reading:
- LBMA Bullion Liquidity Reports (weekly, publicly archived at lbma.org.uk).
- Federal Reserve H.15 historical release, gold lease rate series.
- Frank Veneroso, The 1998 Gold Book Annual — still the most thorough analysis of the mining hedge book and its market impact.
- Adrian Ash, "Gold lease rates explained" (BullionVault research, multiple editions).
Quick reference
| Lease-rate regime | GOFO / lease | What it tells you |
|---|---|---|
| Normal contango | GOFO > 0 | No physical stress, futures > spot in carry |
| Mild tightness | Lease 0.5–1% | Some shortage, watchable |
| Backwardation | Spot > futures | Acute physical demand or vault stress |
| Negative GOFO (rare) | GOFO < 0 | Crisis signal — bullion banks unwilling to lend |