Chapter 3 — From Nixon to now: gold's regimes 1971–2026
On a Sunday evening in August 1971, Richard Nixon gave a televised address. Most of the speech was about a 90-day wage and price freeze meant to fight inflation. But buried in the middle was a single sentence that ended a 27-year monetary order: the United States would no longer convert dollars held by foreign central banks into gold at $35 an ounce.
The Bretton Woods system, in which the dollar was anchored to gold and every other currency was anchored to the dollar, was over. From the next morning, gold and the dollar floated against each other. Anyone holding dollars and expecting gold at $35 had to find a new reference point.
In the 55 years since that speech, gold has traded in six distinct regimes. Each was driven by a different combination of real interest rates, dollar strength, central bank behavior, and political risk. None lasted forever. None was visible at the start. And the trader who survives — let alone profits — over a multi-decade career is the one who can name which regime they are in while it is happening, not in retrospect.
This chapter is the long view. Skim it the first time. Come back to it after you have read Part III on the macro engine, and the pattern will be much clearer.
Regime 1 — The inflation boom (1971–1980)
Gold moved from $35 to $850 in nine years, a rise of more than 2,400%. This is by far the largest sustained gold bull market in the post-fiat era.
The drivers, in order of importance:
- Real yields collapsed. Inflation in the US went from 4% in 1971 to 14% by 1980. Nominal interest rates lagged badly. Real yields — nominal yields minus inflation — were negative for most of the decade. When holding dollars cost you 3-5% of purchasing power per year, gold's lack of yield stopped being a disadvantage.
- Oil shocks. The 1973 Arab oil embargo and the 1979 Iranian revolution quadrupled and then doubled the oil price. Inflation passed through. Gold tracked.
- Dollar weakness. With Bretton Woods gone and Vietnam still draining the budget, the dollar fell against the major currencies. Gold, priced in dollars, rose mechanically.
- Geopolitics. The Soviet invasion of Afghanistan in December 1979 was the spark for the final blow-off top, taking gold from $500 in November 1979 to $850 in January 1980.
The regime ended when Paul Volcker, appointed Fed chair in August 1979, raised the Fed Funds rate to 20%. Real yields turned sharply positive. Gold collapsed.
Regime 2 — The long bear (1980–2001)
For 21 years, gold went sideways and down. From $850 in January 1980 it fell to a final low of $255 in April 2001. In real (inflation-adjusted) terms, the fall was even worse: gold lost roughly 70% of its purchasing power over that period.
The drivers were the inverse of the 1970s:
- Positive real yields. Volcker's tightening tamed inflation. From the mid-1980s through the late 1990s, real yields ran between +2% and +5%. Holding dollars (or Treasuries) paid you a real return. Gold's zero-yield was now a real disadvantage.
- The "Great Moderation." Stable inflation, stable growth, low volatility. Safe-haven demand for gold collapsed.
- Central bank selling. European central banks coordinated reserve sales — the 1999 Washington Agreement formalized this — adding 400 tonnes per year to supply at the worst possible time for gold prices.
- Mining company hedging. Through the 1990s, large gold miners forward-sold years of future production to lock in prices. This added enormous structural selling pressure. (The unwind of this hedging — the "dehedging" — was one of the catalysts of the next bull market.)
The 1999 Brown bottom — Gordon Brown's decision to sell more than half of the UK's gold reserves at an average price of $275 — is, in retrospect, the cleanest signal that the bear was over. When the British Treasury sells the bottom, the bottom is in.
Regime 3 — The commodity supercycle (2001–2011)
Gold rose from $255 to $1,920 in just under eleven years, a 650% move. Unlike the 1970s, this was a stealth bull market — it did not become front-page news until 2008.
The drivers:
- The dollar weakened. After 2002, the trade-weighted dollar fell roughly 30% over six years.
- China. Chinese reserves, household savings, and import demand grew at compound rates. By 2007, China had become the world's largest gold producer and a significant net importer.
- 9/11 and the wars. Iraq, Afghanistan, and the fiscal and monetary response inflated the US balance sheet. Real yields fell.
- The 2008 financial crisis. Quantitative easing, zero interest rates, and a banking system on life support. Gold rallied through the panic and continued through the recovery.
- Mining dehedging. The forward-sold positions of the 1990s were unwound, adding structural buying pressure as miners closed their hedge books.
The regime ended at $1,920 in September 2011, six weeks after the US sovereign credit downgrade by S&P. The downgrade was the public top — the moment retail finally heard about gold — and from that point it became the new high to fail beneath.
Regime 4 — The disinflation drag (2011–2015)
Gold fell from $1,920 to $1,050 over four years. A 45% bear market in real terms, more in nominal.
The drivers:
- Tapering and the dollar. The Fed signaled the end of QE3 in May 2013 ("the taper tantrum"). The dollar rallied. Real yields rose. Gold sold off violently.
- ETF unwind. The 2013 outflows mentioned in Chapter 1 — Western paper sellers vs Eastern physical buyers — paper won the price discovery fight.
- Disinflation everywhere. The eurozone crisis, the Chinese growth slowdown, and the oil price collapse from $115 to $30 between 2014 and 2016 created a synchronized disinflationary environment. Gold's inflation-hedge narrative had nothing to feed on.
This was a textbook gold bear: rising real yields, rising dollar, falling inflation expectations, and ETF capitulation.
Regime 5 — The reflation rally (2015–2020)
Gold rallied from $1,050 in December 2015 to $2,089 in August 2020. A 100% move over five years, with most of it concentrated in the final 18 months.
The drivers:
- Real yields turned negative again. The 10-year US TIPS yield fell from +1% in 2018 to a multi-year low of -1.1% in August 2020.
- Central banks returned as buyers. From 2015 onward, EM central banks began consistent net buying. By 2018-2019 the pace was meaningful.
- The dollar peaked. After topping in early 2017, the trade-weighted dollar drifted lower through 2020.
- COVID. The March 2020 panic, the unprecedented monetary and fiscal response, and the resulting inflation pulse drove the final leg of the rally to $2,089.
The $2,089 high held for three years before being decisively broken — a long consolidation that frustrated many traders who had expected gold to keep running.
Regime 6 — The fragmentation regime (2020–2026 and ongoing)
From the 2020 high of $2,089, gold consolidated for two years between $1,650 and $2,070, then broke out in 2023 and ran to ~$4,700 by mid-2026 — more than doubling in three years.
The drivers of this regime are distinct enough from the previous ones to deserve special attention, because we are still in it:
- Geopolitical fragmentation. The 2022 freezing of Russian central bank dollar reserves changed the structural logic of reserve management for every non-aligned country. Gold ceased being an "alternative reserve asset" and became the primary safe reserve asset for EM central banks.
- Sustained central bank buying. Roughly 1,000 tonnes per year of net central bank purchases since 2022 — three times the previous regime's pace. This is the structural buyer that was missing from prior bull markets.
- Real yields decoupled. For the first time in the post-Bretton-Woods era, gold rallied alongside rising real yields through parts of 2024-2025. The classic real-yield-master-variable relationship weakened. Central bank price-insensitive buying overwhelmed it.
- Dedollarization narrative. Whether or not the dollar's reserve dominance is actually declining, the fear of it is now a constant background bid for gold.
Whether this regime continues, mutates, or ends depends on questions we cannot answer today. Will EM central banks reach their target allocations and slow their buying? Will the US dollar reserve status weaken or hold? Will the next major geopolitical event accelerate or decelerate the fragmentation trend?
For a trader, the answer to "what regime are we in" matters more than any individual indicator. In Regime 1, you bought breakouts. In Regime 2, you sold rallies. In Regime 3, you held through pullbacks. In Regime 4, you avoided the asset. In Regime 5 and 6, you have to know which mechanism is driving — and the mechanism in Regime 6 is not the same as in Regime 1, even though both look like inflation-driven bull markets on the chart.
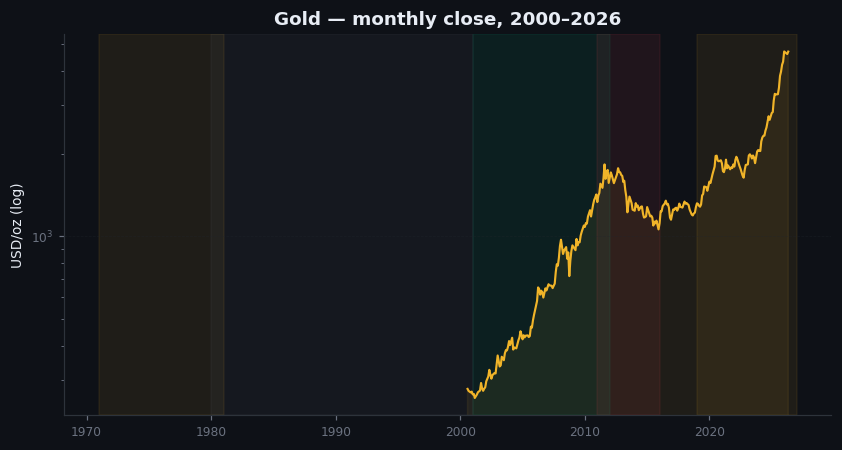
Figure 3.1 — 55 years of gold, 1971–2026
Annotated line chart. Monthly gold price in USD from January 1971 to May 2026. Six shaded regime bands: 1971–1980 (inflation boom), 1980–2001 (long bear), 2001–2011 (commodity supercycle), 2011–2015 (disinflation drag), 2015–2020 (reflation rally), 2020–present (fragmentation regime). Key events annotated: Aug 1971 (Nixon closes gold window), Jan 1980 ($850 peak), Aug 1999 (Brown bottom), Sep 2011 ($1,920 peak), Dec 2015 ($1,050 low), Aug 2020 ($2,089 peak), Feb 2022 (Russia invades Ukraine), 2026 (current).
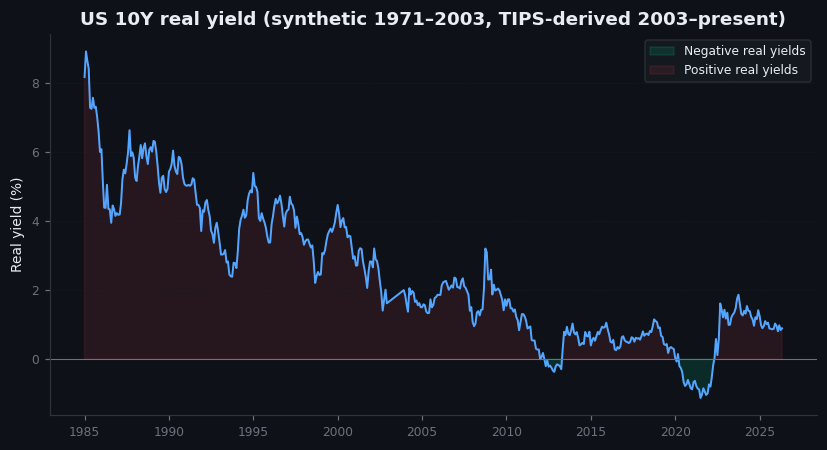
Figure 3.2 — US 10-year real yield, 1971–2026
Line chart. Monthly US 10-year TIPS yield (or pre-1997 estimated real yield) from 1971 to 2026. Plotted on the same time axis as Figure 3.1 so the regime boundaries align visually. Annotations showing where real yields turned negative (1973-1980, 2002-2007, 2010-2013, 2019-2022) and where they turned positive (1981-2001, 2014-2018, 2023-2024). Each negative-yield period roughly aligns with a gold bull market; each positive-yield period with a bear or consolidation.
Illustrative — pre-2003 synthetic real yield (nominal minus inflation estimate); TIPS-derived post-2003.
On goldintel today
The dashboard's Market Drivers panel surfaces the variables that mattered most across these regimes — DXY (dollar), US10Y (proxied real yields), CPI (inflation pulse), VIX (risk-off proxy). What it does not yet surface, and which I have noted as a gap, is central bank flows. In Regime 6 this is the single most important driver, and the dashboard does not yet have a panel for it. Until it does, treat the news feed's central-bank-tagged headlines as your primary source.
When you read this chapter, the question to ask yourself is: which regime are we in right now, and which one was I trading like last week? If your mental model is "gold is in an inflation hedge bull market like 1971-1980," you will be confused when gold rallies during disinflation (as it has, several times, in Regime 6). The Regime 6 driver is reserve diversification, not inflation. Different cause, different exit signal.
Common mistakes
- "Gold is always an inflation hedge." It is, in Regime 1 and most of Regime 3. It is not, in Regime 4 (disinflationary bear), and it is partially in Regime 6 (other forces dominate). Gold is a real-yields hedge, not an inflation hedge. The two are usually correlated, but not always.
- "The previous bull pattern will repeat." Each regime has different drivers. The 1971-1980 bull was inflation. The 2001-2011 bull was dollar weakness plus dehedging. The 2020-present bull is central bank reserve buying. Expecting the 2020s to look like the 1970s on the chart will mislead you.
- "The regime change happened on the date the headlines say." It didn't. Regime 1 ended when Volcker hiked, not when gold peaked. Regime 3 ended when ETF flows turned, not when gold peaked in September 2011. The price top is a consequence of the regime change, lagging by months.
- "We must be near a top now." Maybe. The 1971-1980 bull lasted nine years. The 2001-2011 bull lasted eleven. The 2020-present bull is in its sixth year. Length of bull is a weak signal compared to what is driving the bull.
Key takeaway
Gold trades in regimes, not in trends. Each regime has its own master variable. Knowing which regime you are in matters more than any signal on any timeframe.
Further reading:
- Peter Bernstein, The Power of Gold: The History of an Obsession. The standard reference for the long history.
- Niall Ferguson, The Ascent of Money. Chapter on the post-Bretton-Woods monetary order is essential context.
- Bank for International Settlements, Annual Economic Report — chapters on reserve composition and dedollarization narratives.
- For the Brown bottom specifically: HM Treasury historical reserve data, plus John Plender's columns in the FT 1999-2001 for the political context.
Quick reference
| Regime | Period | Real return | Driver |
|---|---|---|---|
| R1 | 1971–1980 | +1,316% | Inflation, dollar de-pegging |
| R2 | 1980–2000 | −22% | Volcker disinflation, equity bull |
| R3 | 2001–2011 | +248% | Commodity supercycle, weak USD |
| R4 | 2011–2015 | −33% | Strong USD, real yields rising |
| R5 | 2016–2019 | +35% | Mixed, transition |
| R6 | 2019–2026 | +110% | Central bank reserve buying |