Chapter 27 — Seasonality and the gold calendar
Gold has seasons. Some are driven by physical demand cycles — Indian Diwali, Chinese New Year, wedding season in South Asia. Some are driven by financial cycles — fund rebalancing, fiscal year-end, the Fed calendar. Some are driven by structural patterns — summer trading volume, end-of-year positioning unwinds.
None of these patterns is strong enough to be a trade signal by itself. All of them are strong enough, statistically, to be tailwinds when they align with the macro and technical setup. A trader who knows the gold calendar gets a few extra percentage points of edge per year — small individually, meaningful cumulatively, almost free to implement.
This chapter is about that calendar.
The empirical record
Over the past 30+ years, gold's monthly returns show consistent patterns:
| Month | Avg return | Bias | Primary drivers |
|---|---|---|---|
| January | ~+2.5% | Strong | Post-Christmas Western buying, CNY demand acceleration, fresh capital deployment |
| February | ~+1.0% | Moderate | Chinese New Year peak, Indian wedding season |
| March | ~0% | Weak | Spring deceleration of Asian demand, end-of-quarter rebalancing |
| April | flat | Mixed | Soft inflows, retail sentiment often peaks |
| May | flat to − | Mixed | "Sell in May" effect partial; positioning unwinds |
| June | −0.5 to −1% | Weakest | Summer volume drop, news flow slows, half-year-end deleveraging |
| July | flat to − | Weak | Same dynamics as June, occasional risk-premium spikes |
| August | high var. | Mixed (σ↑) | Violent moves common (2011 top, 2020 peak, 2024 yen-carry unwind); low liquidity |
| September | ~+2.0% | Strong | Funds return, fresh capital, Diwali pre-buying begins |
| October | +0.5 to +1% | Moderate | Diwali peak, strong physical demand |
| November | ~+1.5% | Strong | Diwali continuation, year-end repositioning, CNY pre-accumulation |
| December | mixed | Mixed | Year-end profit-taking; tax-loss spillover from mining stocks |
Plotted on a chart, this produces a recognizable "smile" — gold tends to perform best from September through February, with a soft patch through the summer.
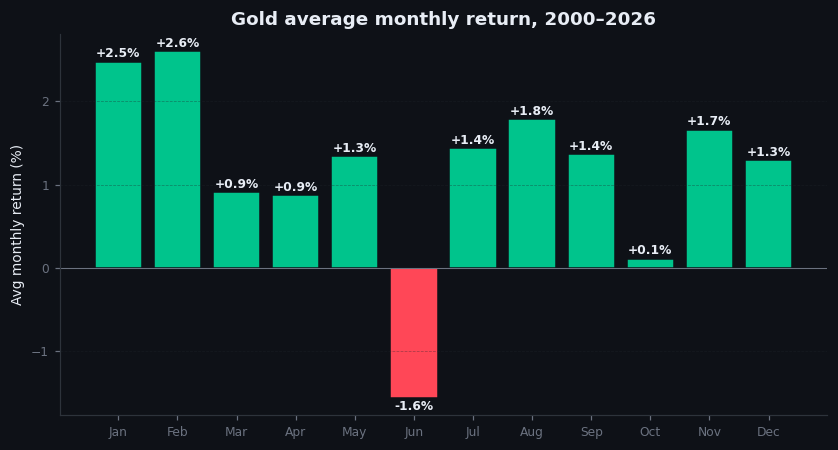
Figure 27.1 — Average monthly gold return, 1990–2025
Bar chart. Average monthly return for gold from 1990 to 2025 (35 years), by calendar month. Visible: January is the strongest month, June is the weakest. The seasonal pattern is statistically significant but not large — typical monthly differences are 1-3 percentage points.
Why the pattern exists
The seasonal pattern in gold is not a market anomaly that should be arbitraged away. It is a reflection of underlying physical and financial cycles that are themselves seasonal:
- Indian gold demand is genuinely seasonal. The wedding season (October-February) and Diwali (October-November) drive measurable jewelry demand. India is one of the world's two largest gold consumers; this is real physical buying that affects spot premia and ultimately the LBMA price.
- Chinese gold demand is seasonal around Chinese New Year (January-February typically) and the autumn festival season. China is the other major consumer; the same logic applies.
- Western financial cycles drive their own patterns. Fund managers return from summer holidays in September with capital to deploy. Year-end tax-loss harvesting affects mining stocks. Q1 typically sees fresh capital allocation to commodities.
- Volume cycles matter independently. Summer trading volumes in gold are 20-30% lower than autumn volumes. Lower volume means smaller flows can move price more, but it also means trends are less reliable.
Because the underlying causes are real, the seasonal pattern persists despite being well-known. Arbitrage cannot eliminate physical wedding demand or fund-manager vacation patterns.
How to use seasonality
The right use of seasonality is as a tailwind — a factor that increases conviction when other signals agree, or decreases conviction when they conflict.
A practical workflow:
- Know what month you are in. Stupid as it sounds, many traders don't explicitly think about this.
- Note whether the historical seasonal is positive, negative, or neutral. From the table above, internalize the broad pattern: Sep-Feb favorable, Mar-Aug less so, with August as the high-variance exception.
- Treat the seasonal as one input. When your macro and technical analysis is bullish and you're entering a historically strong month, lean larger. When your analysis is bullish but you're entering June, lean smaller and be quicker to take profits.
- Do not trade purely on seasonality. A bearish setup in January will still likely lose money even though January is seasonally strong. The seasonal effect is real but small.
The most common practical implementation: a trader who is otherwise neutral on direction adds a slight long bias in September-November and a slight defensive posture in June-July. This is essentially free edge — costs nothing to apply, adds 1-2% to expected returns over a year if done consistently.
Within-month patterns
Beyond monthly seasonality, gold has several intra-month and weekly patterns worth knowing:
- First trading day of each month tends to be slightly positive. New capital deployment.
- Day before and day after each Fed meeting sees elevated volatility. Plan around it.
- Monthly options expiration (third Friday for most monthly products) sees end-of-day pinning and dealer hedging flows. Avoid placing trades that depend on precise execution during that hour.
- End of quarter (March 31, June 30, September 30, December 31) sees rebalancing flows. Direction is hard to predict but volume and volatility are elevated.
These are tactical considerations, not trade signals. Knowing them prevents avoidable mistakes.
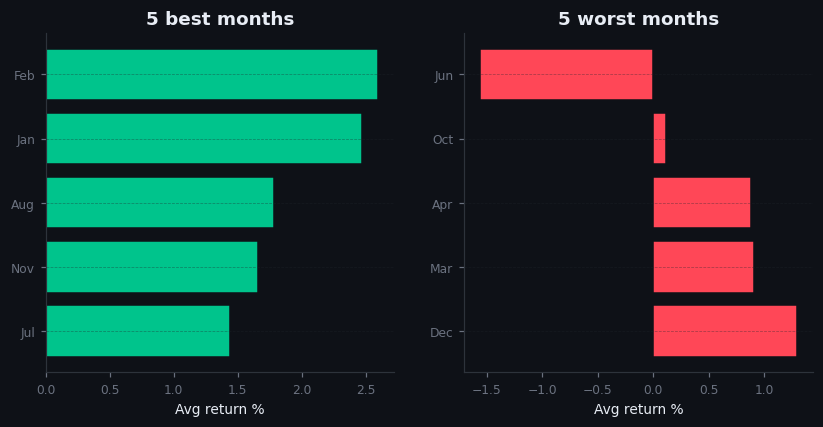
Figure 27.2 — Best and worst months historically
Two-panel chart. Top: Best 5 months ranked by historical average return (January, September, November, February, October). Bottom: Worst 5 months (June, July, March, May, December). Visible: the seasonal "smile" — autumn and early winter favored, late spring and early summer disfavored.
The 2026 regime context
A note about whether seasonality still applies in the current Regime 6.
The seasonal pattern is driven by physical demand cycles. Those cycles have not disappeared — Indian weddings still happen, Diwali still happens, Chinese New Year still happens. Physical demand from these cycles still pulls bars out of London vaults at the same times of year.
What has changed in Regime 6 is that central bank reserve buying — the structural driver of the current bull market — is not seasonal. PBoC buys in November the same way it buys in June. The structural buyer overwhelms the seasonal pattern at certain points.
The practical implication: in the current regime, the seasonal effects are muted compared to historical averages. The "weak summer" can still happen if central bank buying pauses, but the muted pattern means the seasonal edge is smaller. Treat seasonal patterns as a one-percent-edge tailwind in Regime 6, not the two-or-three-percent edge they were in prior regimes.
If and when central bank buying decelerates, expect seasonality to reassert itself with full historical force.
On goldintel today
The dashboard does not currently surface seasonality information. A simple feature — showing the current month's historical performance, the trailing 5-year and 30-year average return for this month, and a "favorable/unfavorable" tag — would add useful context for any trade decision. Until that exists, keep the seasonal pattern in your head.
Common mistakes
- "I'll only trade in seasonally strong months." This filter throws out too many trades. The seasonal effect is real but small; macro and technical analysis still dominate.
- "September is always strong." On average, yes. In any given year, September can be weak. Treat seasonals as probabilities, not rules.
- "Summer is always weak." Same caveat. The 2011 top and the 2020 peak both occurred in summer. Low volume means anything can happen.
- "Seasonality doesn't work anymore." Muted in the current regime, not eliminated. The underlying physical demand cycles still exist.
Key takeaway
Gold has a seasonal pattern: roughly favorable September through February, less favorable March through August. Use it as a tailwind in trade decisions, not as a stand-alone signal. Muted in the current regime; expect reassertion if central bank buying decelerates.
Further reading:
- World Gold Council, Gold Demand Trends — quarterly reports document the physical demand patterns that drive seasonality.
- Jeffrey Hirsch, Stock Trader's Almanac — primarily equity-focused but the methodology for seasonality analysis is sound and applies to gold.
- Frank Veneroso's older research notes on Indian wedding-season gold demand remain the cleanest analysis of that specific driver.