Chapter 26 — The COT report: positioning as a signal
Every Friday, after the close of US markets, the Commodity Futures Trading Commission releases the Commitment of Traders (COT) report. It details the net long and net short positions of different categories of traders in the COMEX gold futures market, as of the previous Tuesday's close. The report is free, public, and has been published for over 30 years.
It is also one of the most under-used institutional indicators available to retail gold traders.
The COT report does not tell you direction. It tells you who is positioned which way, and at what extremes. Used correctly, it is a powerful filter — it answers questions like "is the smart money on my side of this trade?" and "has the herd already piled in here?" Used incorrectly, it produces premature contrarian trades that get stopped out.
This chapter is about how to read COT properly.
What the report actually shows
The CFTC categorizes COMEX gold traders into several groups:
- Producers/Merchants/Processors/Users (P/M/P/U): Commercial entities that handle physical gold — mining companies, refineries, jewelers, central banks (when they use COMEX), bullion banks acting in commercial capacity. These are the "commercials." They use futures primarily for hedging actual physical exposure.
- Swap Dealers: Entities that primarily deal in swaps tied to commodity prices. Mostly bullion banks acting as intermediaries for OTC clients (asset managers, pension funds, ETFs). They are technically commercial but their positioning reflects their clients' demand more than their own price view.
- Managed Money: Speculative hedge funds, CTAs, and managed futures programs. The "smart money speculators." They take directional bets based on macro views.
- Other Reportables: Large speculators that don't fit the above categories. Often family offices and proprietary trading firms.
- Non-Reportables: Small traders below the reporting threshold. Often called "small specs." Historically considered the "dumb money" — heavily retail, heavily directional, often wrong at extremes.
For trading purposes, the two categories that matter most are Managed Money (the smart speculators) and Non-Reportables (the small specs). The Producers (commercials) matter for physical market signals but are usually short-side hedgers regardless of price, so their absolute net position is less informative.
How to read positioning extremes
The useful signal in COT is not the absolute net position; it is the position relative to history. If Managed Money net long is 250,000 contracts, that means little without context. If it is at the 95th percentile of the past 3 years, that is meaningful — Managed Money is more bullish than it has been in years. If it is at the 5th percentile of the past 3 years, that is also meaningful — they are unusually bearish.
A practical workflow:
- Pull the weekly Managed Money net position from the CFTC website or from a tracker like cotbase.com.
- Calculate the percentile rank against the past 156 weeks (3 years).
- Above 80th percentile = Managed Money is extremely long. Conditions for a top, though not necessarily an immediate signal.
- Below 20th percentile = Managed Money is extremely short, or unusually un-long. Conditions for a bottom.
- Compare with price. When Managed Money positioning extremes occur at the same time as price extremes, the alignment confirms the signal. When they occur with price not yet at extremes, treat as a leading condition.
The mistake at this point is to take the position extreme as a trade signal. It is not. Positioning can stay extreme for weeks before resolving. Trying to fade an extreme too early gets you stopped out repeatedly.
The right way to use position extremes: as a condition that gates other signals. When Managed Money is at the 95th percentile and price hits major resistance and there is a bearish divergence on the daily chart and the macro is mildly bearish, those four conditions together produce a high-probability short setup. The COT extreme alone produces a mediocre setup.
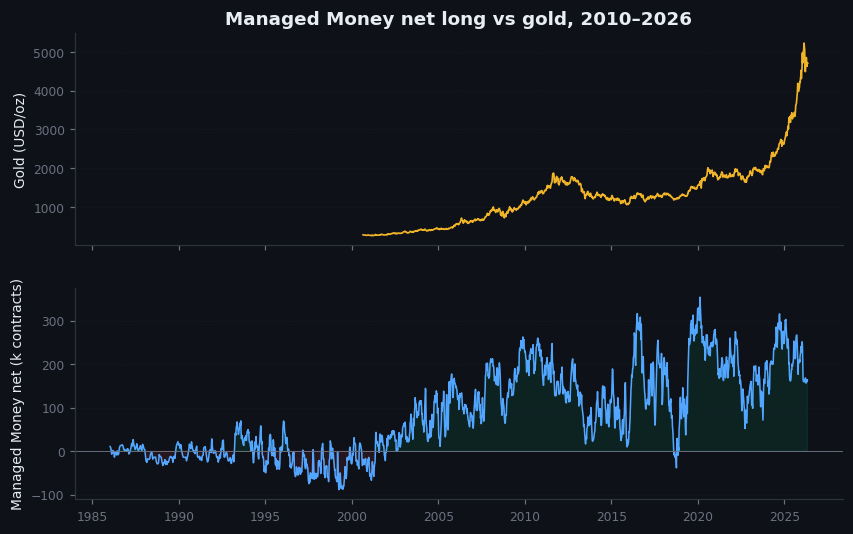
Figure 26.1 — Managed Money net long vs gold price, 2010–2026
Two-panel chart. Top: monthly gold price. Bottom: Managed Money net long position, weekly. Annotations at the major price tops and bottoms showing where Managed Money positioning was relative to its history. Visible: Managed Money was near record highs at the 2011 peak (extreme long) and near multi-year lows at the 2015 bottom (extreme short). At intermediate turns the alignment is less clean but still informative.
The commercial signal
Commercials (Producers + Swap Dealers) are typically net short gold futures. They have a structural short bias because miners hedge production and bullion banks intermediate client longs. So the absolute level of commercial net short is not informative — they are always net short.
What is informative is the change in commercial net short. When commercials reduce their net short — meaning they cover shorts or add longs — they are reducing their hedge protection, which usually signals that they expect higher prices. When they expand their net short — adding to hedges — they expect lower prices.
The commercials are considered the "smart money" because they have informational advantages: they see physical demand directly, they handle large client flows, and they have decades of pattern recognition. Their hedging behavior tends to lead price movements rather than lag them.
The most reliable commercial signal: when commercial net short reaches multi-year lows (i.e., minimal hedging), it has historically been bullish for gold. When commercial net short reaches multi-year highs (i.e., maximum hedging), it has historically been bearish.
The small-spec contrarian signal
The Non-Reportable category — small specs, mostly retail — has a long-running reputation as the "dumb money." Statistically, this reputation is partially deserved. Small specs tend to be heaviest long near price tops and heaviest short near price bottoms. Fading their extremes has been profitable across many decades, though the edge has narrowed as retail trading has become more sophisticated.
For practical use: when small spec net long is at multi-year extremes, that is a contrarian condition. Combined with other signals (price at resistance, momentum divergence, macro turning), it forms part of a high-probability short setup.
The same applies in reverse. Small spec extreme net short with price at support and macro turning bullish is a contrarian long setup.
A worked example
September 2024, COT alignment:
- Managed Money net long: 78th percentile of trailing 3 years. Not extreme, but elevated.
- Commercial net short: Near multi-year highs (heavy hedging). Bearish.
- Small spec: Net long at 85th percentile. Modestly contrarian-bearish.
Combined with price near $2,720 (recent swing high), the COT data argued for caution on the long side and supported considering a tactical short.
The trade outcome: gold pulled back from $2,720 to $2,580 over the following three weeks. A short on the COT alignment plus the price level would have produced a 5% move against the gold price — meaningful, with limited risk if stops were placed above the swing high.
The opposite alignment occurred in late 2022. Managed Money net long was at multi-year lows; commercials had reduced their net short significantly; small specs were heavily short. Price was around $1,650. The COT data argued for a meaningful bullish setup, which played out over the following 18 months with gold rallying to $2,800.
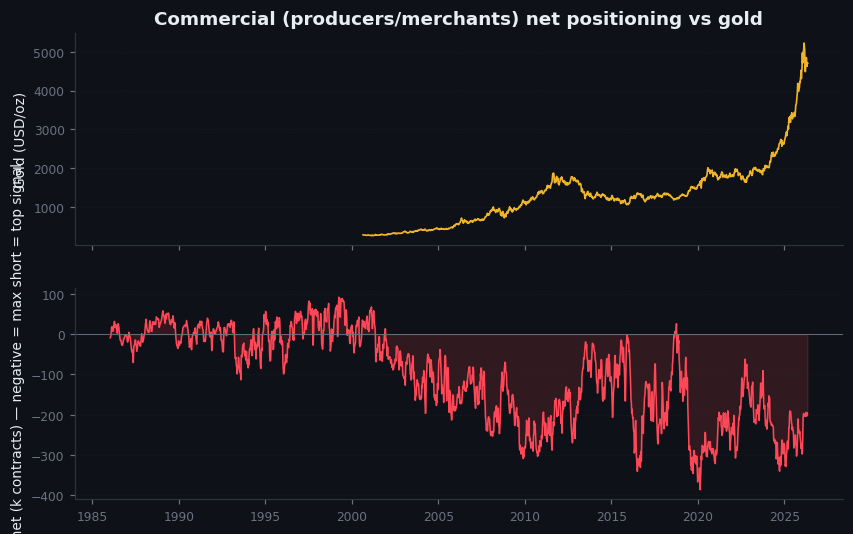
Figure 26.2 — Commercial positioning at major turns, 2010–2026
Line chart of commercial net short position alongside gold price. Annotations at each major turn showing commercial behavior preceding the turn. Visible: commercial net short reached multi-year lows just before the 2008-2009 bottom, the 2015-2016 bottom, and the 2018 bottom. Conversely, commercial net short was at extremes just before the 2011 top and the 2020 top.
On goldintel today
The dashboard surfaces the full COT report in the Institutional Positioning (COT) panel: net positions for each trader category (speculators, commercials, small traders) with long / short / net and week-on-week change, a plain-language read of what the positioning implies, and a live countdown to the next CFTC release. That same positioning read is fed into the brief analysis, so the COT signal shows up in the directional reasoning, not just the panel.
One mapping note. The panel uses the legacy COT report (Non-Commercial / Commercial / Non-Reportable — the older three-category format), while this chapter teaches the disaggregated report (Managed Money / Swap Dealers / Producers / Non-Reportables — the finer 2009+ format). They map cleanly:
- Panel "Speculators" (non-commercial) ≈ Managed Money + Other Reportables
- Panel "Commercials" ≈ Producers + Swap Dealers
- Panel "Small traders" = Non-Reportables
The signal is identical — crowded speculators against hedged commercials — just at slightly coarser granularity. When you read "Speculators heavily long" on the panel, that is the Managed Money crowding this chapter describes.
The panel doesn't yet show historical percentile context (how today's positioning ranks against the last few years). For that, cotbase.com is the cleanest free tracker, and the CFTC's own Commitments of Traders page is the authoritative raw source. Still worth a 5-minute Saturday review for the percentile context — but the weekly net read and its interpretation now live on the dashboard.
Common mistakes
- "Position extremes are entry signals." They are conditions that gate other signals. Trading position extremes alone produces premature trades.
- "Commercials are always right." They lead more often than they lag, but they are not infallible. Commercial signals work best at multi-year extremes; intermediate readings are noisier.
- "Small specs are always wrong." They are wrong at extremes more often than not, but the edge is narrower than it was 20 years ago as retail trading has become more sophisticated.
- "COT works on every commodity." It works particularly well in gold because of the depth of the COMEX market and the long history of clean data. Other commodities have noisier COT signals.
Key takeaway
The COT report is a positioning indicator, not a price signal. Treat extremes as conditions that gate other trade setups. Watch Managed Money for speculative excess and Commercials for smart-money positioning shifts.
Further reading:
- CFTC, Commitment of Traders Report methodology, current edition.
- Larry Williams, Trade Stocks and Commodities with the Insiders — long-running, sometimes promotional, but the COT methodology section is accurate.
- Stephen Briese, The Commitments of Traders Bible — the most comprehensive single text on COT interpretation.
- cotbase.com — interactive tracker with historical percentile data, free tier sufficient for retail use.
Quick reference
| Category | Who they are | Signal use |
|---|---|---|
| Commercials (Producers) | Miners, refiners | Hedge supply; max-short ≈ market top |
| Managed Money | Hedge funds, CTAs | Trend-followers; extremes flag reversals |
| Swap Dealers | Banks | Mirror of commercials; less informative |
| Other Reportables | Family offices, prop | Often "smart money"; watchable |
| Non-Reportable (Retail) | Small specs | Contrarian indicator at extremes |