Chapter 4 — The strange cycle: why gold moves in long arcs
Look at a 55-year chart of gold and one thing is impossible to miss. The price does not move in trends measured in months. It moves in arcs measured in years, sometimes more than a decade.
The 1971–1980 bull ran nine years. The 1980–2001 bear ran twenty-one. The 2001–2011 bull ran eleven. The 2011–2015 bear ran four. The 2015–2020 rally ran five. The 2020–2026 bull is in year six and still going.
This is not normal price behavior. Most asset classes — equities, FX, oil — make their major lows and highs in shorter, more chaotic patterns. Gold moves with a strange unhurried rhythm, as if it were responding to something deeper than the noise that drives most markets.
It is. And once you can see what that something is, the cycle stops feeling mysterious and starts feeling — almost — predictable. Not in timing, but in direction.
What the cycle actually is
The gold cycle is not a price cycle. It is a real-yield cycle with gold as the visible expression.
Real yields — the return on safe government bonds after subtracting inflation — move in long cycles because the underlying forces (Fed policy regimes, fiscal stances, generational political shifts) move in long cycles. When real yields are persistently negative, holding cash costs you purchasing power, and gold's zero yield becomes a feature. When real yields are persistently positive, holding cash pays you a real return, and gold's zero yield becomes a cost.
The arcs in the gold chart are simply the visible signature of underlying real-yield regimes:
- 1971–1980: Real yields persistently negative (high inflation, lagging nominal rates). Gold up 2,400%.
- 1980–2001: Real yields persistently positive (Volcker tightening, Great Moderation). Gold down 70% in real terms.
- 2001–2011: Real yields trending negative (9/11 wars, GFC, QE). Gold up 650%.
- 2011–2015: Real yields trending positive (tapering, disinflation). Gold down 45%.
- 2015–2020: Real yields turning negative again (Trump-era easing, COVID). Gold up 100%.
- 2020–present: Real yields positive but gold rallying anyway because central bank reserve buying overwhelms the yield signal.
The first five regimes line up almost perfectly with the real-yield cycle. The sixth is the anomaly — the first regime in the post-Bretton-Woods era where gold and real yields decoupled, because a new buyer category became dominant. That decoupling is a teaching moment by itself, which we will return to in Chapter 11.
Why the cycles are long
Real-yield regimes are slow-moving because the things that drive them are slow-moving. A Fed chair's policy stance is roughly a 4-8 year commitment. A fiscal regime — the political appetite for deficits — runs over an electoral cycle or longer. A generational shift in inflation tolerance — what economists call "regime credibility" — can take a decade to establish or break.
When Volcker took inflation from 14% to 3% between 1979 and 1983, the credibility of low inflation took another 15 years to fully cement. The disinflation he engineered didn't just happen because rates were high — it happened because successive Fed chairs (Greenspan, Bernanke) and Treasury Secretaries reinforced the same anti-inflation stance for two decades.
The gold bear market that ran from 1980 to 2001 was not a 21-year directional bet against gold. It was a 21-year signal that the macro regime — credible disinflation, real yields steadily positive — was holding. The moment that regime cracked (the 2001 tech bust, falling rates, the start of the long real-yield decline), gold's bull began.
This is why the cycle is long. The drivers underneath are slow. Gold is simply the most legible reflection of them.
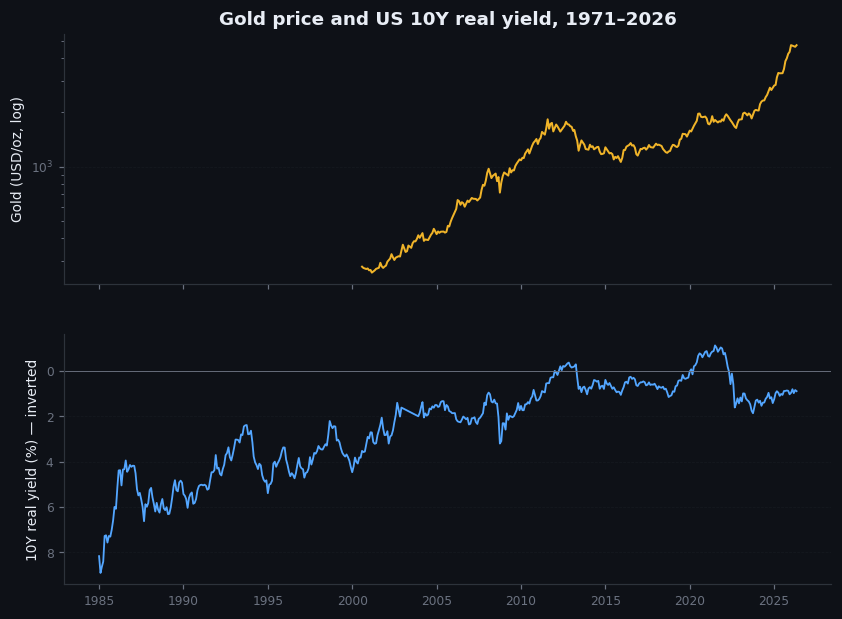
Figure 4.1 — Gold price and US 10-year real yield, 1971–2026
Two-panel chart, stacked vertically with shared time axis. Top panel: monthly gold price 1971–2026 in log scale (so the percentage moves are visually comparable across decades). Bottom panel: estimated US 10-year real yield over the same period. Visible: bull markets in gold (1971–80, 2001–11, 2015–present) align with periods of falling or negative real yields; bear markets in gold (1980–2001, 2011–15) align with rising or persistently positive real yields. Annotation arrow on the bottom-right showing the 2024–2026 anomaly where gold rallied while real yields rose.
Illustrative — pre-2003 synthetic real yield; TIPS-derived post-2003.
Lengths and asymmetries
Two empirical observations worth committing to memory.
Bull markets in gold are shorter than bears. The 1971–1980 bull lasted nine years. The 2001–2011 bull lasted eleven. The 2015–2020 rally lasted five. The current 2020–present bull is at year six. Compare with the 1980–2001 bear at twenty-one years. Gold bulls are explosive and concentrated; gold bears are slow and grinding.
For a trader, this asymmetry has a practical implication. In bull regimes, you want to be long, sized up, and patient. The price will give you back periodic corrections of 15–25%, but it will keep grinding higher because the macro tide is rising. In bear regimes, you want to be flat or short rallies, sized small, and quick to exit, because the price will give you violent counter-trend rallies that look like new bulls but aren't.
Tops are events; bottoms are processes. The 1980 top happened in three weeks, took gold from $500 to $850 and back. The 2011 top was sharper still — a six-week parabolic blow-off, then a five-year decline. The 2001 bottom, by contrast, was a 19-month basing pattern between $255 and $290 that nobody recognized as a bottom until two years later. The 2015 bottom was similar — a 14-month base between $1,050 and $1,250.
The lesson: catching a gold top is technically possible because tops are announced by their own price action — parabolic acceleration, retail euphoria, mainstream media coverage. Catching a gold bottom is much harder because bottoms are silent. The price just stops going down. Nobody notices.
Where we are now
In May 2026, gold is in year six of a bull market that began at ~$1,650 in March 2020 and is trading near $4,700. By prior-cycle benchmarks, this bull is in its mid-to-late stages — past the 2001-style stealth phase, past the 2008-style crisis acceleration, but not yet at the parabolic terminal phase that marked 1980 and 2011.
Two things make this cycle different from prior ones, and they push the call in opposite directions:
- It might be early. Central bank reserve buying is a structural force that did not exist in prior cycles. If EM central banks are nowhere near their target allocations, the structural bid continues for years. This is the "this time is different" bullish case.
- It might be late. The price has already 2.8x'd in six years, which historically is enough to top. The retail flows into gold ETFs have begun. Some of the late-cycle signals (newspaper covers, mining stocks parabolic, family-office allocations) are starting to appear.
I don't know which call is right. The honest position is to trade the regime as long as the regime holds, and to watch for the specific signals that suggest it is breaking. Those signals — covered in Part III — are the dollar reversing, real yields rising sharply, central bank buying decelerating, and ETF flows turning extreme.
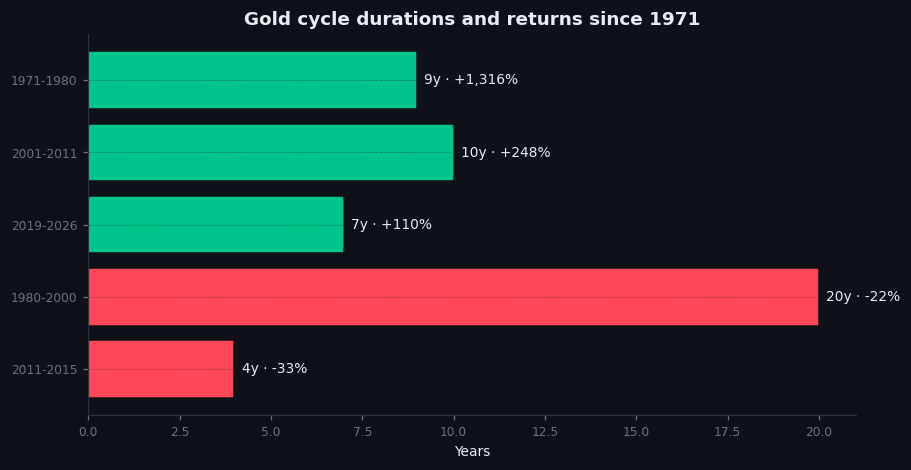
Figure 4.2 — Bull market durations, comparison
Horizontal bar chart. Five bars: "1971–1980 bull (9 years, +2,329%)," "2001–2011 bull (11 years, +653%)," "2015–2020 rally (5 years, +98%)," "2020–present bull (6+ years, +183%)," "Average prior gold bull (10 years, +1,000%)." Vertical line at 6 years showing where the current cycle stands.
Illustrative — schematic timeline; durations and returns are real.
On goldintel today
The dashboard does not show the long view directly — the GoldChart component is limited to recent intraday or daily data. For the long cycle perspective covered in this chapter, use TradingView's monthly XAUUSD chart on log scale and turn off all indicators. Look at the price alone over 55 years. The arcs will be obvious. The dashboard's role is intraday and weekly tactical context, not cycle awareness.
Common mistakes
- "The cycle is mechanical." It is not. 1971–1980 was 9 years; 1980–2001 was 21. The drivers determine the length, not a calendar.
- "We must be near a top because the bull is old." Age alone is a weak signal. Drivers matter. A bull driven by a structural new buyer (Regime 6) can run longer than one driven by Western ETF flows alone.
- "This time is different." Sometimes it is. Sometimes it isn't. The 1971-style inflation bull never recurred because the macro regime that produced it didn't recur. But the general principle — bulls run while real yields are negative or central banks are buying — has held across every cycle.
- "I'll wait for the top before going long." You will miss most of the move. Bulls accelerate at the end; the parabolic phase is real but it is a small percentage of total time-in-bull-market. Most of the gains happen in the boring middle.
Key takeaway
Gold moves in long arcs because the real-yield and central-bank regimes that drive it move in long arcs. Position by regime, not by signal.
Further reading:
- Frank Veneroso, The Gold Book Annual (various editions, 1990s–2000s) — the most rigorous historical analysis of the gold supply and demand cycle.
- John Hathaway, various Tocqueville Funds gold strategy letters, 2001–present. Long-running practitioner perspective on the cycle.
- For real-yield history pre-TIPS (i.e. before 1997), the cleanest reconstruction is in Hamilton's Time Series Analysis and the various Fed working papers on inflation expectations measurement.
Quick reference
| Pattern | Length | Recognition signal |
|---|---|---|
| Sustained bull | 7–10 years | Higher highs through 3+ macro shocks |
| Sustained bear | 4–20 years | Failed rallies into prior support |
| Transition phase | 1–3 years | Range-bound, narrative change |
| Mini-cycle within regime | 6–18 mo | Pullback ≥ 15% then new highs |