Chapter 18 — The 85:15 rule and your edge
Here is a claim that should make any technical-analysis purist uncomfortable: roughly 85% of significant gold price moves are driven by macro variables, and only roughly 15% are driven by technical or microstructure factors.
This is the 85:15 rule. The exact percentage is not the point — I have seen analysts argue for 80:20, others for 90:10. The point is the order of magnitude. Gold is, far more than most other liquid markets, a macro-driven asset. Charts, indicators, candle patterns, and support/resistance work some of the time. The underlying macro variables work most of the time.
This is not an argument against technical analysis. It is an argument for contextual technical analysis. The 15% of moves that are technical in nature still matter — they are the moves you will trade tactically, on horizons of days to weeks. The 85% of moves that are macro tell you whether you should be trading those tactical moves long or short. Mismatching the two — using technicals to trade against the macro tide — is the most common avoidable mistake in gold trading.
This chapter is the bridge between Part III (macro) and Part IV (technicals). Read it carefully; the entire trading framework depends on it.
What the 85% looks like
The macro 85% breaks down into:
- Real yields: roughly 40% of price variation, in normal regimes. The single largest driver across most of the post-Bretton-Woods era.
- Dollar / cross-asset flows: roughly 20%. Through DXY, broad TWI, and the feedback loop into non-dollar demand.
- Central bank flows: roughly 15% in normal regimes, much higher in Regime 6 (current). The structural buyer that drives multi-year direction.
- Sentiment / risk-on-risk-off: roughly 10%. Through VIX, equity volatility, geopolitical events, and headline-driven safe-haven flows.
These are not precise numbers from a regression; they are rough attributions across the past 20-25 years of gold price movements. The point is the rank order, not the exact percentages.
The 85% manifests in two forms:
- Persistent moves — slow, multi-week or multi-month price drifts driven by changes in the macro variables. These are the trends that experienced gold traders care about most because they pay the most.
- Event-driven moves — sharp price reactions to scheduled releases (CPI, NFP, FOMC) or unscheduled events (geopolitical, central bank announcements). These are usually fully priced within minutes to hours.
The trader's job is to understand which macro variables are currently driving (this changes regime to regime, as Chapter 3 made clear), to position with the direction those variables imply, and to use technicals only for entry timing and risk management.
What the 15% looks like
The technical 15% covers:
- Mean reversion and ranges. Inside long macro trends, prices oscillate. A trader who sells the top of a range and buys the bottom can capture meaningful returns within a macro trend without needing to call its end.
- Breakouts and trend continuations. Technical setups that align with the macro direction. These tend to work; setups that trade against the macro direction tend to fail.
- Squeeze and positioning unwinds. When the futures market gets unusually long or short (Chapter 26), counter-positioning trades can produce sharp 1-2 week moves.
- Round numbers and key levels. Psychological levels ($2,000, $3,000, $4,000) trigger algorithmic responses and human reactions that are real, predictable, and tradeable.
- Microstructure flows. Options gamma, dealer hedging, end-of-quarter rebalancing — these create technical patterns at known times that quants exploit.
The 15% is less than the 85% but it is still meaningful. For a trader with limited capital and a need for higher trade frequency, the 15% provides the day-to-day opportunity set. The 85% provides the bias that determines which side of the 15% trades you should be taking.
Combining the two
The integration is straightforward in principle, harder in practice:
- Step 1: Identify the macro regime and direction. Real yields trending up or down? Central bank buying accelerating or stalling? Dollar trend? Inflation expectations? This determines your bias — long or short — over horizons of weeks to months. Update weekly, not daily.
- Step 2: Identify the technical setup. Where are we relative to key levels? What does the daily chart structure look like? What does the multi-timeframe alignment say? What does positioning look like? This determines your entry and exit — the tactical execution within the macro bias.
- Step 3: Trade only setups that align with bias. If your macro bias is bullish, take long entries on technical setups. Skip short setups, even if they look attractive on the chart. The expected value of fighting the macro tide is negative over enough trades.
- Step 4: Size by macro conviction, time by technical setup. Strong macro conviction = larger position size. Weak or ambiguous macro = smaller. The technical setup determines when to enter, not how much.
This is not complicated, but it requires discipline. Most retail traders skip step 1 and trade on technicals alone. They achieve win rates around 50% (random) and lose to commissions and spreads over time. The traders who consistently make money in gold are the ones who do step 1 and then use steps 2-4 to execute.
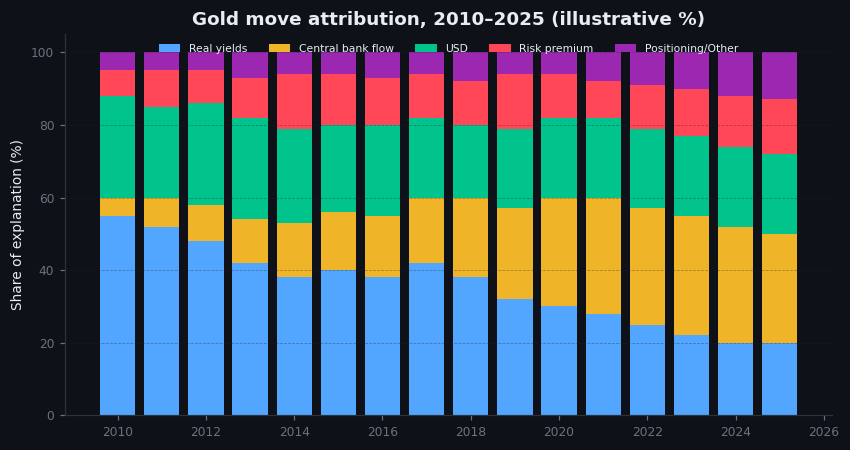
Figure 18.1 — Attribution of gold moves, 2010–2025
Stacked area chart. Annual gold returns 2010 to 2025, broken into estimated attributions: real-yield contribution, dollar contribution, central-bank-flow contribution, sentiment contribution, residual (technical/microstructure). Visible: real yields explain most variation through 2010-2021; central bank flows dominate from 2022 onward. Residual (technical 15%) is consistently small.
Illustrative — illustrative driver attribution.
A worked example
September 2024. The setup, in 85:15 terms:
- Macro (85%): Real yields were declining as the Fed pivoted dovish ahead of the September cut. Central bank buying was accelerating (PBoC resumed in late 2024). Broad dollar had peaked and was rolling over. Yen carry trade unwind was reducing US asset inflows. Every macro variable was bullish gold.
- Technical (15%): Price was in a multi-week consolidation between $2,540 and $2,620. A clean breakout from this range above $2,620 would be a tactical entry. Below $2,540 would be a tactical exit (potentially short, but only if the macro turned).
The trade: macro bias = long. Watch for the technical breakout. When price broke $2,620 in late September, take the long. Stop below $2,605 (just below the breakout level, ATR-sized). Target: open-ended, trail the position while the macro stays bullish.
The result: gold rallied from $2,620 to $2,790 over the following two weeks, then consolidated, then continued to $2,820 by mid-October. A clean technical setup that worked because the macro was aligned.
The counter-example: the same technical setup (breakout from $2,540-$2,620 range) in 2013 would have failed, because the macro in 2013 was bearish (rising real yields, ETF outflows, Fed tapering). A trader who took the same breakout entry in the wrong macro regime would have been stopped out repeatedly.
The technical setup did not produce the win. The macro context did. The technical setup was the execution method.
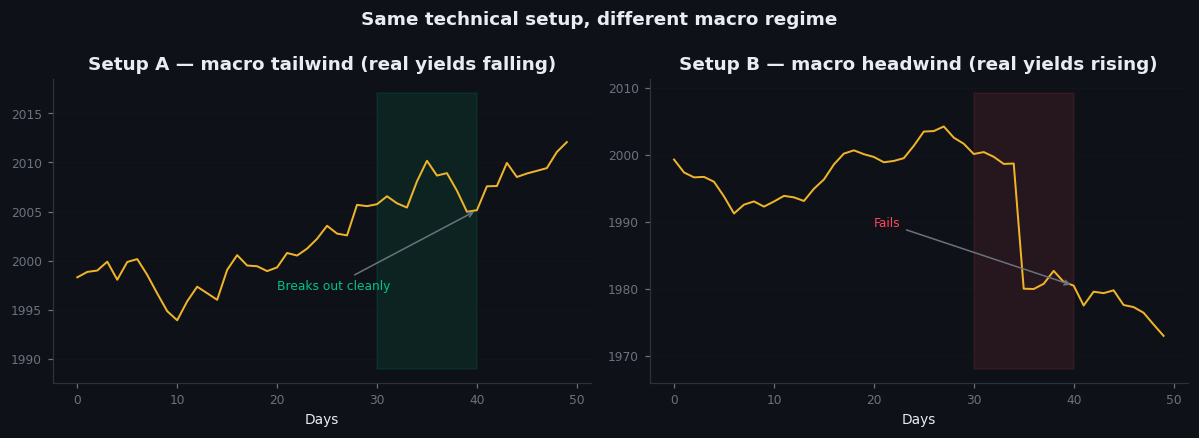
Figure 18.2 — Same technical setup, different macro regime
Two charts side by side. Left: September 2024 breakout from $2,540-$2,620 range, trade hits target. Right: a similar range-breakout setup from 2013 in a bearish macro regime, trade is stopped out. Same technical pattern, opposite outcome, because the macro context determined success.
Illustrative — schematic — two hypothetical setups.
On goldintel today
The dashboard organizes its information in a way that maps onto the 85:15 rule, though it does not name the rule explicitly.
- The Market Drivers, Session Briefs, News Feed, and Confluence Scorecard are macro-layer (the 85%).
- The Technical Indicators, SMC Panel, Pivot Levels, and Strategy Engine are technical-layer (the 15%).
A correct workflow on goldintel: read the macro layer first (5 minutes), form a bias, then use the technical layer for entries and risk management. The reverse workflow — looking at the chart first and then justifying with macro — is how most retail traders use it, and it produces the predictable mediocre results.
Common mistakes
- "Technicals don't work on gold." They do, on horizons of days to a couple of weeks, when aligned with the macro bias. The pure-technical-against-the-macro trade has negative expected value.
- "Macro is too slow for short-term trading." It is, as a trade signal in itself. But it is the right framework for bias. The execution can still be daily or hourly.
- "85% is too high — half the moves are technical." Empirically, the macro share is higher than most retail traders think. The technical share is smaller. Eyeballing the chart over years can produce the illusion of more technical structure than actually exists in the data.
- "I'll trade pure technicals and let macro work itself out." This works in some markets (very technical FX pairs, some equity indices). It does not work as well in gold. Gold's macro sensitivity is too high.
Key takeaway
Macro drives gold. Technicals time the entries. The 85:15 rule is the foundation of every chapter that follows in Part IV — read those chapters knowing that technicals are tools for execution, not for direction.
Further reading:
- This rule is folk wisdom in the gold-trading community more than it is published academic finance. The closest formal treatment is in various Goldman Sachs commodities research notes attributing gold's price variation to specific variables.
- For a rigorous statistical analysis of macro attribution: Frank Veneroso's Gold Book Annual editions (1990s-2000s) plus updated working papers by Currie / Goldman on commodity factor models.
- Schwager, Market Wizards — every gold trader in the book describes a workflow that maps to this rule, even if none names it explicitly.
Quick reference
| Driver | "85%" regime (macro-led) | "15%" regime (positioning-led) |
|---|---|---|
| Real yields | Dominant | Backdrop |
| CB flow | Backdrop | Background (slow-moving) |
| Positioning | Lagging | Dominant |
| News flow | Confirming | Trigger |
| Technicals | Mid-game timing | Reversal flag |