Chapter 29 — Position sizing: the only math that matters
A trader can be wrong about direction more than half the time and still make money. A trader can be right more than half the time and still go broke. The difference is position sizing.
This is not a clever observation; it is arithmetic. If you risk 5% per trade and win 50% of the time on equal-magnitude winners and losers, you will eventually have a drawdown bad enough to wipe you out. If you risk 1% per trade with the same statistics, you will compound positively over enough trades. The signal is identical. The math is different.
Position sizing is, mathematically, the only edge that doesn't decay. Indicators stop working, regimes shift, your edge in pattern recognition erodes as the market evolves. The math of risk per trade is invariant. It works the same way for a 1995 gold trader and a 2026 gold trader, regardless of regime, indicator, or strategy.
This chapter is about doing the math correctly.
The single most important number: risk per trade
Risk per trade is the maximum amount of capital you are willing to lose on any single position. It is expressed as a percentage of account equity. The number should be small, fixed, and respected without exception.
For most discretionary traders, the recommended range is 0.5% to 2% risk per trade. Below 0.5% the position is too small to matter to your returns. Above 2% the math starts working against survival.
The rough math at different risk levels:
- At 1% risk per trade: A 10-loss losing streak (rare but happens) costs you ~9.5% of capital. Recoverable. A 20-loss streak (very rare) costs ~18%. Painful but not fatal.
- At 2% risk per trade: A 10-loss streak costs ~18%. A 20-loss streak costs ~33%. Recoverable but slow.
- At 5% risk per trade: A 10-loss streak costs ~40%. A 20-loss streak costs ~64%. Recovery requires a 178% return from those drawdowns just to get back to breakeven. Practically, this kills most traders psychologically before they get back.
- At 10% risk per trade: A 7-loss streak costs ~52%. An 11-loss streak costs ~69%. Career-ender for almost everyone.
This is the geometric brutality of compounding losses. Each loss reduces your capital base, which reduces the dollar value of subsequent positions (if you size by percentage of equity), which slows recovery. The math is unforgiving.
The discipline: pick a number in the 0.5% to 2% range. Write it down. Use the same number for every trade unless you have an explicit reason to deviate. Most professional discretionary traders settle around 1%.
The Kelly criterion (briefly)
The mathematically optimal risk per trade, given known win rate and win/loss ratio, is given by the Kelly criterion:
Kelly fraction = (Win probability × Average win - Loss probability × Average loss) / Average win
For a trader with 50% win rate and 2:1 average win-to-loss ratio:
Kelly = (0.50 × 2 - 0.50 × 1) / 2 = 0.25
This says: risk 25% of capital per trade. Which is insane. Kelly is the theoretically optimal sizing for maximum geometric growth over an infinite horizon assuming exact knowledge of win rate and payoff. In practice, three issues:
- Win rate is uncertain. Your estimate of "50%" might be 40% in reality. Kelly is extremely sensitive to win rate estimation errors.
- Payoffs are uncertain. Real win/loss ratios vary trade to trade. Kelly assumes the average; reality has fat tails.
- The optimal size leads to enormous drawdowns. Even with exact knowledge, Kelly produces ~40% peak-to-trough drawdowns that almost no human can tolerate psychologically.
The practical adaptation is fractional Kelly — using 25% or 50% of the theoretical Kelly size. For a 25% Kelly applied to the example above, that gives 6.25% per trade — still too high for most traders. The standard 1% rule is implicitly something like 5-10% of theoretical Kelly, which is conservative for a reason: it survives the cases where your statistics estimates are wrong.
For practical purposes: stop thinking about Kelly. Use 0.5-2% per trade. Move on.
How to calculate position size
Given:
- Account equity = $50,000
- Risk per trade = 1% = $500
- ATR on daily gold = $35
- Entry price = $2,720
- Stop = $2,685 (1 ATR below entry)
- Stop distance = $35
Position size = Risk amount / Stop distance = $500 / $35 = 14.3 ounces.
Round to 0.10 of a standard lot (since 1 lot = 100 ounces, you trade 0.14 lots — round to 0.10 or 0.15 depending on your broker's increment).
The position size now risks approximately $500 if stopped, regardless of how confident you feel about the trade.
This calculation should be done every single trade. Not eyeballed. Not "I usually trade 0.10 lots." Calculated. The ATR changes. Your stop placement changes. Your account equity changes. The position size should change accordingly.
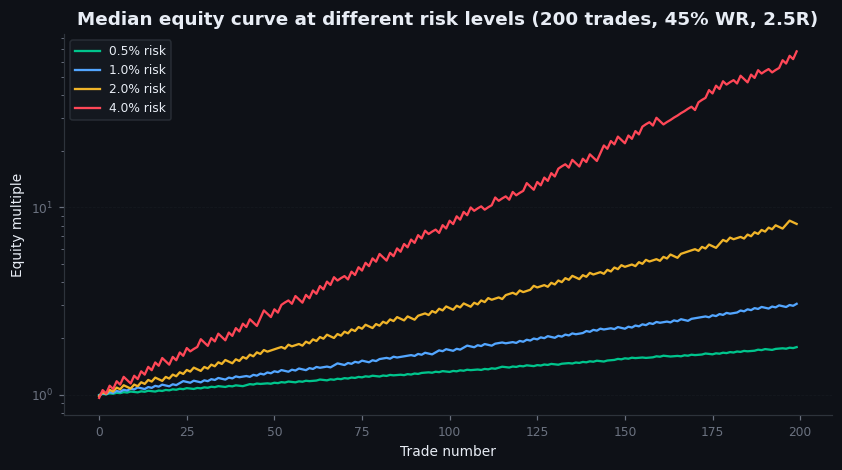
Figure 29.1 — Equity curves at different risk levels
Monte Carlo simulation chart. Same underlying trading edge (55% win rate, 1.5:1 average win/loss), with 1,000 simulated trade sequences of 500 trades each. Plotted: median and 5th-95th percentile equity curves at 1% risk per trade, 2% per trade, and 5% per trade. Visible: at 1%, median curve grows smoothly with moderate drawdowns. At 2%, growth is faster but drawdowns deeper. At 5%, growth is fastest in the median case but the 5th percentile path goes to zero — a meaningful chance of ruin even with a positive edge.
Illustrative — Monte Carlo simulation (45% WR, 2.5R, 200 trades, 200 paths).
Position sizing by conviction (briefly)
Some traders adjust position size based on their conviction in the specific trade. A "high-conviction" setup gets 2% risk; a "moderate" gets 1%; a "speculative" gets 0.5%.
This works if your conviction is calibrated — meaning your "high-conviction" trades actually win more often than your "moderate" trades. Most traders' confidence is poorly calibrated; they are overconfident in trades that feel clean and underconfident in trades that look messy but are actually higher-probability based on the underlying setup.
A reasonable rule: do not vary position size by conviction unless you have data showing your conviction signal works. Track 50+ trades labeled by conviction at entry, then compare win rates by category. If high-conviction trades win 65% and moderate trades win 50%, conviction-based sizing makes sense. If they win 55% and 55% respectively, your conviction signal is noise and uniform sizing is better.
Until proven otherwise, treat all trades as 1% risk. Use the same size discipline regardless of how the setup feels.
Survival probability and risk of ruin
For any positive-edge strategy, the probability of ruin (defined as reaching 50% drawdown, which most traders cannot recover from psychologically) is a function of risk per trade, win rate, and win/loss ratio.
A rough table for a typical discretionary edge (55% win rate, 1.5:1 win/loss):
| Risk per trade | Probability of 50% drawdown over 500 trades |
|---|---|
| 0.5% | ~3% |
| 1.0% | ~12% |
| 2.0% | ~38% |
| 3.0% | ~58% |
| 5.0% | ~85% |
The numbers are illustrative but the rank order is robust: doubling your risk per trade more than doubles your ruin probability. Compounding losses is non-linear.
The implication for a 30-year career: at 1% risk per trade you will probably survive any individual bad year. At 5% per trade you almost certainly will not survive five bad years in a row, which most careers will see at some point.
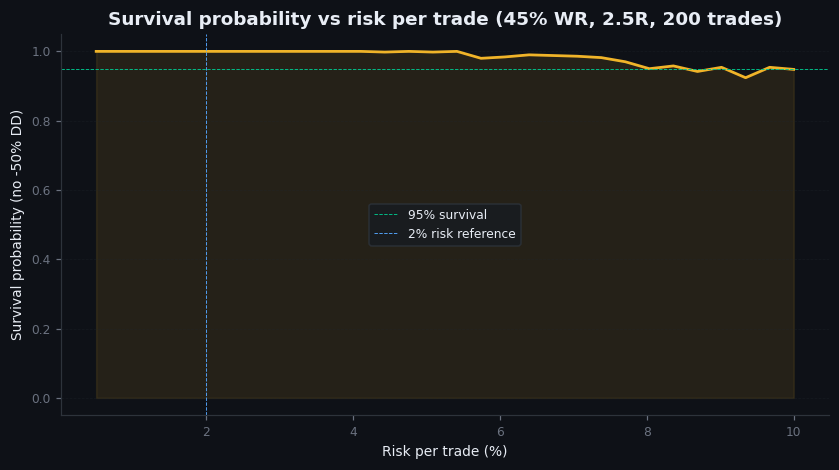
Figure 29.2 — Survival probability vs risk per trade
Curve plot. X-axis: risk per trade (0.5% to 10%). Y-axis: probability of 50% drawdown over 500 trades, assuming 55% win rate and 1.5:1 win/loss ratio. Curve rises steeply from low risk to high risk. A vertical line at 2% marks the inflection above which ruin probability rises sharply.
Illustrative — Monte Carlo survival simulation.
On goldintel today
The dashboard does not currently include a position-size calculator. This is a feature gap worth closing — a simple form taking account size, risk percentage, entry, and stop, returning the recommended position size, would prevent more avoidable losses than any indicator.
Until then, use a spreadsheet or do the math manually before every trade. The calculation takes 30 seconds. The discipline of doing it every time is more valuable than any other workflow change.
Common mistakes
- "I'll size up on this trade because I'm sure." Confidence is not calibrated. Sizing up on confident trades produces larger losses on the trades where the confidence was misplaced — which, statistically, you cannot identify in advance.
- "I'm trading small enough that I don't need to calculate." Then trade slightly larger and calculate. Skipping the math means your risk per trade drifts; you end up with 3% on some trades and 0.3% on others, with no consistency.
- "I'll add to losers because the trade thesis is still intact." Sometimes correct, often catastrophic. Adding to losers doubles your effective risk on a trade that has not yet validated. Save the doubling-down for explicit "scaling in" plans set up before entry.
- "I'll risk 5% on this one because it's a generational setup." Generational setups happen every quarter according to traders' own assessments. The math of compounding losses does not care about your story.
Key takeaway
Position size is the only edge that doesn't decay. Set risk per trade at 0.5-2% and respect it. Calculate position size from account size, risk percentage, and stop distance — every trade, without exception.
Further reading:
- Van Tharp, Trade Your Way to Financial Freedom — the cleanest practitioner-oriented treatment of position sizing.
- Edward Thorp, A Man for All Markets — the original Kelly criterion application to trading, written by the practitioner who actually used it.
- Ralph Vince, The Mathematics of Money Management — denser, more technical, useful for the formal mathematics.
- Sandy Jadeja's writings on stop placement and sizing in the context of gold and FX trading specifically.