Chapter 1 — What gold actually is
In March 2020, in the first week of pandemic lockdowns, the gold market broke.
For four days, the price of gold in London — set by the LBMA spot reference, the world's wholesale benchmark — diverged from the price of gold in New York — set by COMEX active-month futures — by as much as $80 an ounce. Eighty dollars. A market that normally tracks itself within twenty cents.
The reason was prosaic. Commercial flights between London and New York had stopped. The 400-ounce Good Delivery bars that COMEX traders use to settle futures contracts could no longer reliably move across the Atlantic. The standard arbitrage — buy a futures contract, deliver against it with London-vaulted gold, pocket the basis — couldn't function. So the two prices, normally locked, drifted apart.
By the end of the following week the relationship reattached. Refineries in Switzerland began recasting 400-ounce London bars into the 100-ounce kilobars that COMEX accepts. Cargo flights resumed. The spread closed. But for those four days, every trader who held a position got a glimpse of something most traders never see: gold is not one market. Gold is two markets, the physical and the paper, held together by a tendon of trust and a network of logistics. And that tendon can stretch.
This is the first thing to understand about gold. Not the chart. Not the macro drivers. Not the Fed. The asset itself. Because every other lesson in this book sits on top of it.
The pyramid
Imagine a pyramid.
At the bottom is physical gold. Roughly 210,000 tonnes of it have ever been mined in human history. About half is in jewelry — necklaces, rings, bangles, mostly in Indian and Chinese households. About 20% is in central bank vaults. About 20% is held by private investors and institutions as bars and coins. About 10% is in industrial use, mostly electronics and dentistry. The 10% in industrial use is the only slice that gets consumed; the rest is essentially indestructible. Every gram of gold ever mined still exists somewhere.
That 210,000 tonnes is the entire physical layer. At the prices we are working with today it is worth roughly $32 trillion. It exists. It can be touched. It is also, almost all of it, sitting still.
Above the physical layer, in the pyramid, is vaulted Good Delivery gold. This is the slice of physical gold that is accessible to the market — held in the major bullion vaults of London, New York, Zurich, Hong Kong, Singapore, and a few smaller centers. Each bar is registered, weighed, assayed, and accredited under LBMA Good Delivery rules. Roughly 35,000 tonnes sits in this network at any given moment. This is the layer that actually backs traded gold.
Above that is paper gold — the claims, contracts, and derivatives that traders actually buy and sell. ETF shares (GLD, IAU, and their international cousins). Futures contracts on COMEX and Shanghai. Forwards traded over-the-counter. Structured products. Unallocated bullion accounts.
And at the very top of the pyramid is the price — the single number that appears on your chart. It is set, in real time, by the intersection of supply and demand in the paper layer, anchored to the vaulted layer by a network of arbitrage and convertibility promises.
When you click "buy" on XAUUSD in your trading platform, you are not buying physical gold. You are buying a contract that says: at some price, you can exchange this for physical gold if you want to. The price you see is the market's best guess at what that exchange is worth right now.
99% of the time, the anchor holds. The paper price tracks the physical price within a few cents. The pyramid stands.
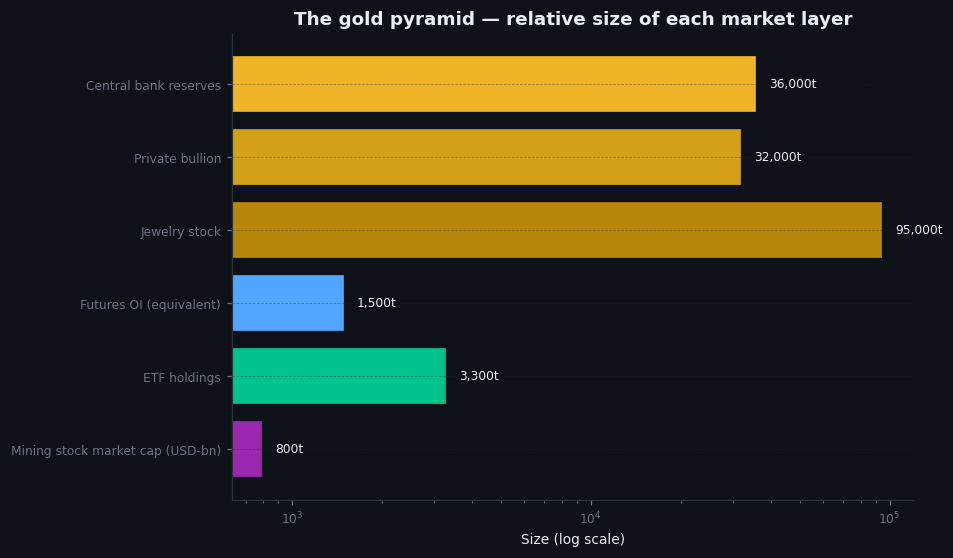
Figure 1.1 — The gold pyramid
Diagram: four-layer pyramid. Base: "Physical gold ever mined — 210,000 tonnes." Layer above: "Vaulted Good Delivery — ~35,000 tonnes (London, NY, Zurich, HK, SG)." Layer above: "Paper claims — ETFs, futures, OTC forwards, unallocated accounts." Apex: "Spot price — set by LBMA and tracked by COMEX." Convertibility arrows between layers, with the arrow between paper and vaulted labelled "the tendon."
Illustrative — schematic, sizes based on WGC published aggregates.
When the pyramid bends
The anchor is not infinitely strong. It is a chain of logistics, contracts, and reputational commitments. And it can bend.
The March 2020 episode is the cleanest modern example. The COVID flight stoppage broke the physical movement channel between London and New York. EFP — the Exchange For Physical mechanism that lets a futures trader swap their COMEX contract for a London-vaulted bar — couldn't function. The two prices drifted. The drift looked small in absolute terms but for a market that normally trades a sub-dollar basis, an $80 gap is an earthquake.
The 1980 silver Hunt brothers corner is another example, in silver but instructive. The Hunt brothers tried to corner physical silver, force shorts to deliver against their futures positions, and discovered (the hard way, after the CFTC and the exchanges intervened) that the rules of the paper market are not designed to allow the physical layer to be exhausted. The exchanges raised margin requirements, then changed the rules mid-game. The Hunts were liquidated. Silver collapsed from $50 to $11 in two months. The lesson: the paper layer has self-defense mechanisms that retail traders almost never see, and those mechanisms favour the system staying connected.
The 2013 ETF unwind is a third example, subtler. When GLD experienced sustained redemptions through the first half of 2013 — bars being released from the trust's London vaults — the paper price fell sharply, from $1,693 to $1,180 in six months. But the physical layer kept being drained, not added to, because Asian buyers (especially China and India) were absorbing the bars that ETFs were releasing. Western paper sellers and Eastern physical buyers were two sides of the same trade, and the paper side won the price-discovery battle while losing the inventory battle. For a trader, the moral was: when the paper market does something unusual, ask what the physical market is doing. Most of the time the answer is "nothing different." But when the answer is "the physical market is doing the opposite," that is a signal worth paying attention to.
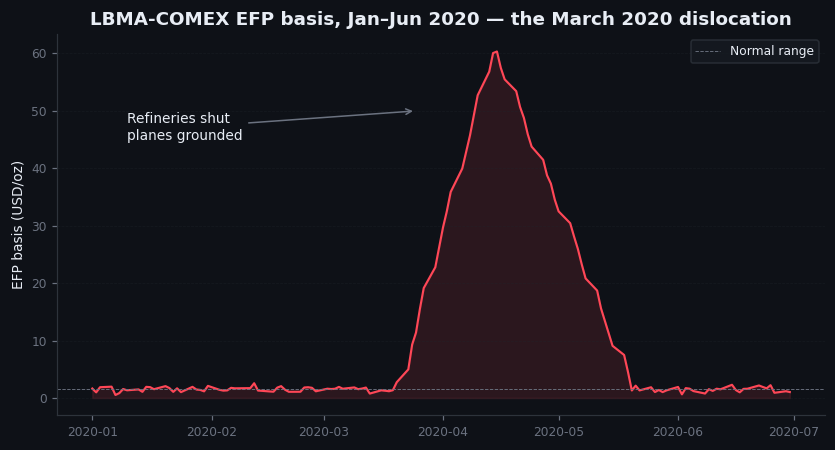
Figure 1.2 — The 2020 LBMA / COMEX divergence
Annotated chart: gold price from March 1 to March 31, 2020. Two lines — LBMA spot (London) and COMEX June futures (New York) — visibly diverging from March 23 through March 27, peak gap roughly $80. Vertical annotations: "Mar 23: commercial flights halted," "Mar 24: EFP breaks down," "Mar 25–27: spread widens," "Mar 30: Swiss refineries recast bars," "Mar 31: spread closes." Light grey background.
Illustrative — illustrative event reconstruction (March 2020).
What you are actually trading
So when XAUUSD prints on your screen, what is it?
It is the LBMA spot price, polled in real time from a network of bullion banks. It is, more specifically, the bid-ask midpoint of the most recent OTC trades between the half-dozen banks that make a market in spot gold for institutional clients — JPMorgan, HSBC, UBS, ICBC Standard, Scotia, and a handful of others. Twice a day, in an electronic auction, those banks formalize a reference fix: the LBMA Gold Price AM (10:30 London) and PM (15:00 London).
It is not the COMEX futures price, though it tracks it within basis.
It is not the ETF NAV, though it tracks that too.
It is not the price you would pay to buy a Krugerrand from a dealer in Dubai, which carries a 3–5% premium for retail.
It is the wholesale, institutional spot reference. The same number an Australian gold miner uses to invoice a Swiss refiner. The same number the World Gold Council publishes. The same number the LBMA fixes twice a day.
When you trade it, you are taking a position on the wholesale price of physical gold as derived from a paper market backed by a network of vaults. That sentence is a mouthful, but it is the truth. Every other simplification — "I'm trading gold" — is a useful shorthand that hides the mechanism.
Why this matters
You can trade gold for a year and never need to think about any of this. The paper price will track the physical price. Your platform will quote you XAUUSD. You will make or lose money based on directional bets.
But the day will come — and it always does — when something unusual happens. A central bank announcement that catches the market wrong-footed. A logistical disruption. A war. A bank failure. A regulatory change. And on that day, the simplification will break. The paper price will move one way and the underlying physical demand will move another. Your indicators will give one signal. The underlying market will be doing something different.
On that day, the traders who survive are the ones who understand which layer of the pyramid they are exposed to. The traders who don't survive are the ones who thought "I'm trading gold" was the whole story.
That is why this chapter exists. Not to make you a pedant. To make sure you know, in the back of your mind, what you are actually holding when you click buy.
On goldintel today
The price you see in the dashboard's top ticker — check the live price now — is the LBMA spot quote, polled by our market-data provider and pushed to the page every minute. The percentage change is calculated against the previous London close. When the dashboard says "Gold: $X (-0.31%)," that is a statement about the wholesale paper price set by London bullion banks, anchored to the vaulted physical layer described in this chapter.
If you ever see a number on the dashboard that diverges sharply from your broker's XAUUSD quote, that is informative. Retail brokers sometimes use slightly different reference sources, especially during low-liquidity hours (the gap between the US close at 17:00 ET and the Asian open at 18:00 ET). The dashboard is meant to be the institutional reference, not the retail one.
Common mistakes
- "I'm trading the price of gold." You are trading the paper market's estimate of the gold price. 99% of the time the two are the same. 1% of the time they are not, and that 1% can move a position by a multiple of normal daily range.
- "Physical and paper always move together." They do, until they don't. The 2020 LBMA / COMEX divergence, the 2013 ETF / Asian-buyer divergence, the 1980 Hunt corner — three examples in fifty years, but they teach the same lesson.
- "The Fed sets the gold price." The Fed influences the macro environment that drives the gold price. The price itself is set by a few dozen bullion bank traders in London and Chicago, twice daily at the fix and continuously between them in OTC.
- "COMEX has the gold to deliver against all open contracts." COMEX's registered (deliverable) inventory is a few hundred tonnes against open interest worth tens of thousands of tonnes. The system works because almost no one ever asks for delivery — they roll their futures forward instead. When someone does ask, the EFP mechanism converts the contract to London-vaulted gold. That conversion is the tendon, and it has stretched before.
Key takeaway
Gold is two markets — the physical and the paper — held together by convertibility. You trade the paper. The physical anchors the paper 99% of the time. The 1% is where the lessons are.
Further reading:
- Bron Suchecki, "How the gold market really works," Perth Mint research notes (2014–2020 series).
- LBMA, "A guide to the Good Delivery rules," current edition (lbma.org.uk).
- World Gold Council, Gold Demand Trends, quarterly publication (gold.org).
- Bank for International Settlements, Triennial Central Bank Survey — gold market microstructure sections.
Quick reference
| Layer | Approx size | Liquidity | Who lives here |
|---|---|---|---|
| Central bank reserves | ~36,000 t | Strategic | National central banks, sovereign funds |
| Private bullion | ~32,000 t | Low | HNWI, family offices, ETF allocators |
| Jewelry stock | ~95,000 t | Slow-leakage | Indian/Chinese households, retail trade |
| COMEX futures (OI) | ~1,500 t equiv | Very high | Funds, dealers, producers, speculators |
| ETF holdings | ~3,300 t | High | Retail + institutional Western investors |
| Mining stock market cap | ~$800 B | Very high | Equity investors, mining-sector traders |