Chapter 13 — Inflation: when it works, when it's broken
Gold is an inflation hedge. Every introductory finance text says so. Most retail traders believe it. Most goldbug commentators rely on it as the foundational argument for the asset.
It is true. Sometimes. Not always. The relationship between gold and inflation is conditional, regime-dependent, and far more nuanced than the standard framing suggests. The 1970s were a great gold inflation hedge. The early 1980s were a terrible one. 2008-2011 worked well. 2021-2022, the inflation surprise of a generation, only worked partially. Understanding when gold hedges inflation and when it does not is one of the most useful pieces of knowledge a gold trader can carry.
This chapter is about that distinction. Read it alongside Chapter 11 on real yields, because the two are intimately related.
What inflation actually is
Inflation, as measured by official statistics, is a basket of price changes weighted by household consumption. The headline measures most relevant to gold:
- CPI (Consumer Price Index). The most widely cited measure. Reported monthly in the US (by the BLS) for the prior month. Covers a basket of goods and services purchased by urban consumers.
- Core CPI. CPI excluding food and energy. Less volatile, considered a better measure of underlying inflation trend.
- PCE (Personal Consumption Expenditures). The Fed's preferred inflation measure. Different weighting, different basket, typically runs 0.3-0.5% below CPI.
- Core PCE. The Fed's most preferred measure. This is the number the FOMC dot plot is calibrated to.
- PPI (Producer Price Index). Wholesale prices, measured at the factory gate. A leading indicator for CPI by 1-3 months.
For a gold trader, the most important inflation number released each month is not CPI. It is the 5-year, 5-year forward inflation expectations derived from TIPS-Treasury spreads (the "5y5y forward breakeven"). This is the market's estimate of what inflation will average between 5 and 10 years out — the long-run inflation pulse that drives long-term real yields and therefore gold.
A CPI print that comes in 0.1% above expectations might move gold $20 for an hour. A change in 5y5y breakevens of 10 basis points is more important than any single CPI print and will move gold persistently over weeks.
When gold hedges inflation
The gold-inflation relationship works cleanly when real yields fall as inflation rises. That is, when nominal yields lag the inflation pulse, so that rising inflation produces falling real yields.
This was the 1970s. CPI ran from 4% in 1971 to 14% by 1980. Nominal 10-year yields rose from 6% to 11% over the same period — they tracked higher, but they did not keep pace. Real yields fell from +2% to -4%. Gold, driven by collapsing real yields, rallied 24x.
This was also 2008-2011. The financial crisis triggered massive Fed easing. Headline CPI ran between -2% and +4% during the period, volatile but not particularly high. What mattered was that the Fed kept nominal rates pinned at zero while expected inflation drifted up from the 2008 deflationary scare. Real yields fell from +1% in late 2008 to -1% by 2011. Gold tripled.
In both cases, the gold-inflation story worked because inflation was outrunning monetary policy. The Fed was either unwilling or unable to keep nominal rates above inflation expectations, so real yields fell, and gold rallied.
When gold does not hedge inflation
The gold-inflation relationship breaks when the Fed runs nominal rates ahead of inflation. Then rising inflation produces rising real yields, and gold falls despite higher inflation.
This was 1980-1985. CPI peaked at 14% in 1980 and fell to 3% by 1983 — historically high inflation throughout. But Volcker raised nominal rates to 20% in 1981. Real yields rose from -3% to +8%. Gold fell from $850 to $300 — losing more than 60% during a period when many observers expected it to perform well as the inflation hedge.
This was also 2021-2022, more subtly. Inflation surged from 1.7% in early 2021 to 9.1% by mid-2022 — the largest inflation shock in 40 years. Gold's response was disappointing to anyone expecting a 1970s repeat. Why? Because the Fed pivoted hawkishly in late 2021 and raised the Fed Funds rate from 0% to 5% over 16 months. Nominal yields rose alongside inflation. Real yields started rising from -1% in mid-2021 to +1.5% by mid-2022. Gold went sideways at $1,800 for most of the year, then fell to $1,615 by October 2022. The inflation surprise of a generation produced almost no sustained gold rally.
The trade then started working again in late 2022, but for a different reason — the central bank reserve buying story (Chapter 10) — not the inflation story.
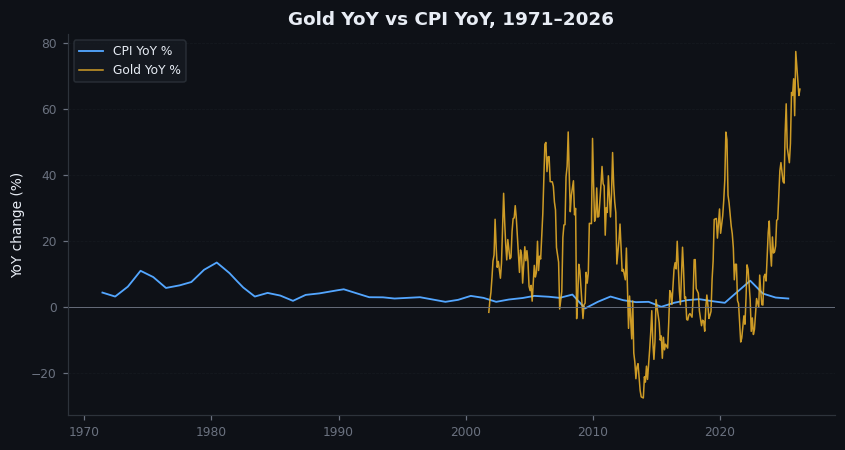
Figure 13.1 — CPI vs gold, 1971–2026
Two-panel chart. Top: year-over-year US CPI, monthly, 1971 to 2026. Bottom: gold price, same period. Visible: gold rallies during 1971-1980 (high CPI), gold bear during 1980-2001 despite CPI staying meaningfully positive, gold rally 2008-2011 (moderate CPI), sideways during the 2021-2022 inflation surge. Annotation arrows showing where the gold-inflation relationship worked vs broke down.
Illustrative — CPI YoY constructed from BLS annual values (interpolated); gold YoY real.
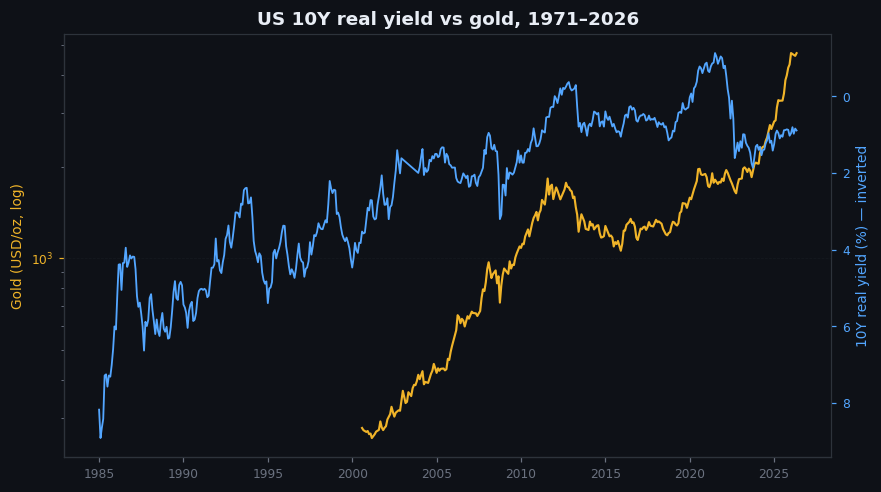
Figure 13.2 — Real yields vs gold, 1971–2026
Same time period, but with the bottom panel showing estimated US 10-year real yield instead of CPI. Visible: much tighter relationship across the entire period. Falling real yields = rising gold. Rising real yields = falling gold. Far cleaner than the CPI chart above.
Illustrative — pre-2003 synthetic real yield; TIPS-derived post-2003.
The comparison between Figures 13.1 and 13.2 is the lesson of this chapter. Gold tracks real yields. Gold tracks CPI only when CPI is driving real yields lower.
The implication for trading on inflation prints
A trader watching CPI prints on the monthly release calendar needs to ask one question on each release: will this print change real yields, or just nominal yields?
If the print is in line with expectations, breakevens stay flat. Nominal yields might move on growth expectations, but real yields don't move much. Gold response: muted.
If the print is meaningfully higher than expectations and the market expects the Fed to under-respond (dovish reaction), nominal yields rise less than breakevens. Real yields fall. Gold rallies.
If the print is meaningfully higher than expectations and the market expects the Fed to over-respond (hawkish reaction), nominal yields rise more than breakevens. Real yields rise. Gold falls.
The market's expectation of the Fed reaction matters more than the print itself. This is why "hot CPI = gold up" and "hot CPI = gold down" can both be true on different days, depending on the prevailing Fed regime.
The clearest example was in 2022. Through most of the year, hot CPI prints produced negative gold reactions because the market interpreted them as forcing more Fed tightening. Real yields rose with each surprise. Gold fell. The standard inflation-hedge framing was actively misleading.
On goldintel today
The dashboard's news feed picks up CPI prints when they release. The Market Drivers panel shows CPI (year-over-year, most recent). What it does not yet show are inflation expectations — the 5y5y breakeven, the Cleveland Fed survey, or the Michigan inflation expectations. These are the variables that actually predict gold, not the historical CPI print.
Until they are added, the workflow is: read CPI print → cross-reference with how nominal yields moved → infer whether real yields moved up or down → that is your gold direction signal. Adding it manually is annoying but the dashboard cannot yet do it for you.
Common mistakes
- "High inflation = high gold." Sometimes. Conditional on Fed reaction function and real-yield path. The 1980-2001 bear market and the 2021-2022 sideways action both happened during meaningful inflation.
- "Trading CPI prints based on the headline number." The market reaction depends on surprise (vs expectations), not the absolute level. A 3.2% print is hot if the consensus was 2.8% and cold if the consensus was 3.6%.
- "Core PCE is what matters because the Fed watches it." True, but the market reaction on release day is dominated by the headline CPI print because it releases first and gets the immediate algorithmic response.
- "Inflation expectations are slow-moving and don't matter for trading." They matter most of all, because they are what drives real yields. 5y5y breakeven moves slowly but persistently, and the persistent moves are what gold tracks.
Key takeaway
Gold hedges real yields, not nominal inflation. Inflation matters only when it drives real yields lower. In regimes where the Fed runs nominal rates ahead of inflation, gold underperforms even during high-inflation periods.
Further reading:
- Federal Reserve Bank of St. Louis (FRED), 5-Year, 5-Year Forward Inflation Expectation Rate series.
- John Cochrane, "Inflation and Real Yields," various blog posts and lectures at the Hoover Institution.
- BLS, Consumer Price Index methodology — read at least once to understand what the headline number actually measures.
- For the 1970s-vs-2020s comparison: Charles Kindleberger and Robert Aliber, Manias, Panics, and Crashes, recent editions.
Quick reference
| Indicator | Cadence | Release timing (UTC) | Fed weight | Gold relevance |
|---|---|---|---|---|
| CPI (US) | Monthly | ~13:30 mid-month | Reference | High — direct read |
| Core CPI | Monthly | Same as CPI | Higher | Higher (less food/energy noise) |
| PPI | Monthly | ~13:30 mid-month | Leading | Medium — CPI predictor |
| Core PCE | Monthly | Last Fri of month | Primary | Highest (Fed target) |
| 5Y5Y breakeven | Daily | Continuous | Forward expectations | High — anchors real yields |