Chapter 20 — Support, resistance, and the round number
In November 2009, gold crossed $1,000 an ounce for the first time. The level had been a ceiling for the previous six years, broken briefly in March 2008 and again in February 2009 before falling back. When $1,000 finally gave way for sustained trading in late 2009, gold spent the next two years rallying to $1,920 — a 92% move that began the moment the round number broke.
In August 2020, gold crossed $2,000 for the first time. The level had been spoken of for nine years as the "next big level." When it broke, gold spiked to $2,089 within days. The level then held for three years as a ceiling, frustrating traders who expected a clean continuation.
In late 2023, gold crossed $2,000 for sustained trading. Within 18 months it had reached $4,000, breaking through every $500 level along the way. Each $500 round number functioned as a temporary speed bump — a few days of consolidation, sometimes a sharp pullback, but ultimately a level that gave way.
Round numbers matter in gold trading. They matter more than most other forms of support and resistance, and they matter for a specific reason: every algorithm, every options trader, every retail order book, and every institutional risk manager places orders at round numbers. The gravitational pull is real. The bounce at the round number is real. The break is real. And the pattern is reliable enough that a trader who pays attention to round numbers has a tactical edge.
The mechanics of horizontal levels
Support and resistance levels work for one simple reason: market participants remember them. If gold traded at $2,500 a week ago and bounced from that level multiple times, the next time price approaches $2,500, three groups of traders are watching:
- Traders who bought at $2,500 last time are looking to add. They are buyers around that level.
- Traders who sold short at $2,500 last time are looking to cover. They are also buyers around that level.
- Algorithms with $2,500 stops are programmed to act when the level is touched. Some are buyers, some are sellers, depending on configuration.
The combination of these orders creates order book density at the level. When price approaches, those orders execute. The price either bounces (because the orders absorb the move) or breaks through (because the orders are exhausted). Both outcomes are tradeable. Both outcomes leave evidence on the chart — bounces produce wicks, breaks produce candle bodies through the level.
The strength of a level is roughly proportional to:
- How many times it has been tested. A level tested three times is more significant than one tested once.
- How long ago it was tested. Levels from the past 6 months are stronger than levels from 3 years ago.
- How much volume traded at the level. Heavy-volume tests leave bigger memories.
- Whether the level is a round number. Round numbers automatically attract orders even without prior testing.
For a trader, the workflow is: identify the relevant horizontal levels on the daily and weekly charts, mark them, and watch for price to approach those levels with a plan in advance.
The round number phenomenon
Round numbers — multiples of $100, $500, $1,000 — work for a different reason than testing-derived levels. They work because humans place orders at round numbers and algorithms account for the human pattern.
A retail trader who decides to buy gold "around $2,500" does not mean exactly $2,500. They mean "somewhere in that area." But when they place the actual limit order, they round to $2,500. The same trader who decides to sell at "around $2,800" places the sell order at $2,800 exactly. Multiply this by millions of retail accounts and the round numbers accumulate disproportionate order flow.
Algorithmic systems know this. They place their own orders slightly above the round number (for buying) or slightly below it (for selling) to front-run the retail orders. Then market-makers position to take the other side of the algorithmic orders. The result is a self-reinforcing concentration of activity at round numbers.
The empirical pattern in gold:
- At $X,000 levels (e.g., $2,000, $3,000, $4,000): price tends to consolidate for days or weeks before either breaking through or rejecting. The level either becomes the new floor or the rejected ceiling.
- At $X,500 levels (e.g., $2,500, $3,500): less significant than $X,000 levels but still meaningful. Short-term bounces and rejections are common.
- At $X,X00 levels (e.g., $2,650, $2,700): smaller magnitude effect. Visible on hourly charts but rarely on the daily.
For positioning purposes, the round-number effect is most useful at major levels. A trader approaching $4,000 should expect that level to matter; one approaching $4,037 should not assume the same significance.
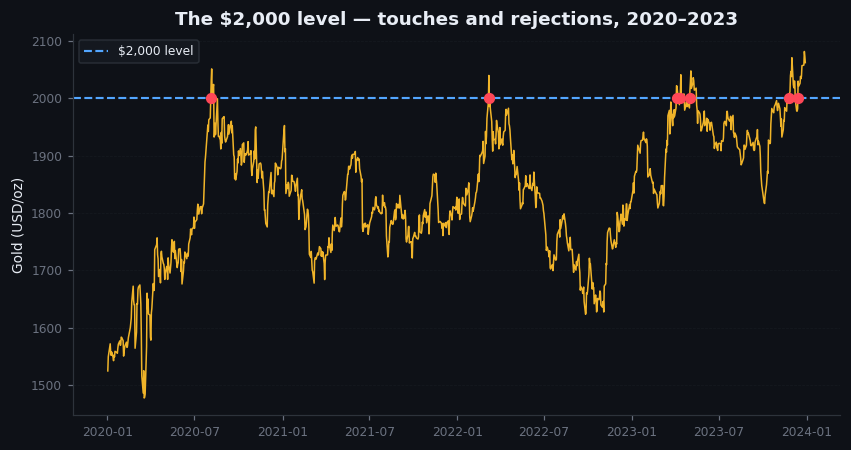
Figure 20.1 — The $2,000 level, 2020–2023
Annotated chart. Monthly gold price from January 2020 to December 2023. The $2,000 line drawn horizontally. Visible: first break in August 2020 (spike to $2,089), retracement, second break in March 2022 (peak around $2,050), retracement again, third and finally sustained break in late 2023. The level acted as a ceiling for almost three years. Annotations explaining the bounces and the eventual structural break.
How to use levels in practice
A practical workflow for identifying and trading horizontal levels:
- On the weekly chart, mark the significant swing highs and lows of the past 12 months. These are your primary levels. Typically 5-10 of them.
- On the daily chart, mark the swing highs and lows of the past 60 days. These are your secondary levels. Typically 5-10 of them.
- Identify the nearest round numbers above and below current price. $X,000, $X,500, $X,X00. Add these to your level map.
- When price approaches any of these levels, watch carefully. The two scenarios:
- Rejection (level holds): price touches the level and reverses. Trade direction is into the move that follows the rejection. Entry is on confirmation (a clean candle in the reversal direction). Stop is just beyond the level. Risk is small because you know exactly where you are wrong.
- Break (level fails): price closes through the level and holds. Trade direction is with the breakout. Entry is on the close through the level, or on a retest of the broken level from the other side. Stop is back inside the prior range. Risk is moderate.
This is the entire technical playbook for horizontal levels. Most retail traders complicate it; most experienced traders strip it back to roughly these four steps.
Trendlines and channels
Diagonal levels (trendlines, channels) work in gold but less reliably than horizontal levels.
The reason: gold's macro drivers move in arcs (Chapter 4) but the day-to-day price action zigzags within those arcs. A trendline drawn on a 6-month chart will be touched cleanly two or three times, then broken in either direction without the trendline mattering much for the next 6 months.
Recommended use of trendlines:
- For confirmation of the trend direction, not as primary trade triggers.
- For managing exits — a clean trendline break can be a signal to take profit on a trend trade.
- For channel definition — when price oscillates between parallel trendlines, the channel itself can be a tradeable range.
Avoid using trendlines for primary entry signals. The slippage on a trendline-based entry is usually high, and the trendline often gets violated intra-day even when the underlying trend remains intact.
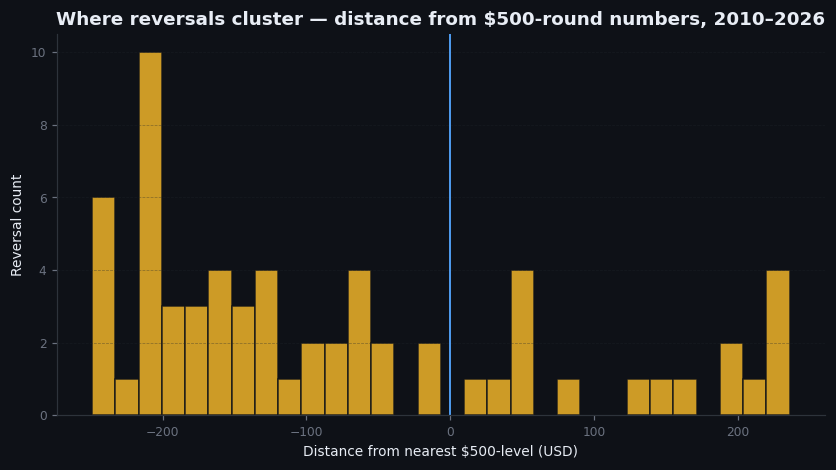
Figure 20.2 — Round number behavior at $X,000 levels, 2010–2026
Composite chart. Each $1,000 level marked on a gold price chart from 2010 to 2026: $1,000, $2,000, $3,000, $4,000. Visible: each level produced a period of consolidation (between 30 days and 3 years) before either breaking or rejecting. The pattern is consistent. Annotations show the consolidation periods and the eventual direction.
On goldintel today
The dashboard's Pivot Levels panel surfaces support and resistance levels derived from recent price action — useful as a starting point for the level map, though not a complete substitute for the manual workflow described above. The technical indicators panel also surfaces some level-derived signals.
For comprehensive level analysis, supplement the dashboard with a manually-marked TradingView chart. Mark your own levels at least weekly; rely on the dashboard's automatic levels as a secondary confirmation rather than a primary input.
Common mistakes
- "This is a level because I drew a line." A level is a level because the market remembers it. Lines drawn on a chart without evidence of testing or round-number significance are decoration, not analysis.
- "The level held twice, so it will hold the third time." Levels held twice often break the third time. The "rule of three" exists in technical analysis folklore for a reason — by the third test, the level's defenders have often been exhausted.
- "Trendlines are more important than horizontal levels." Reverse. Horizontal levels are more reliable. Trendlines are supplementary.
- "Round numbers are arbitrary and shouldn't matter." They should not matter, in a purely rational market. They do matter, in real markets, because of how humans and algorithms actually behave.
Key takeaway
Horizontal levels and round numbers work because market participants remember them. Mark the relevant levels weekly, watch for price reactions at those levels, and trade the reaction (bounce or break) with predefined risk.
Further reading:
- Edwards and Magee, Technical Analysis of Stock Trends — the canonical reference for horizontal and diagonal levels. Long, but the foundational chapters are essential.
- Stockcharts.com and the ChartSchool reference pages on support and resistance.
- For round-number effects specifically: Donald MacKenzie and Yuval Millo's research on algorithmic order flow at price clusters, American Journal of Sociology and related papers.
Quick reference
| Level type | Priority | Typical reaction |
|---|---|---|
| Multi-year horizontal | Highest | Major rejection / breakout zone |
| 200D / 200W moving average | Very high | Trend-defining; reclaim or lose |
| Prior weekly H/L | High | Swing context |
| Round numbers ($x,500/000) | Medium | Psychological clusters |
| Daily pivot (P, R1–3, S1–3) | Medium | Intraday range markers |
| Fib retracements | Conditional | Useful only if cluster with above |